The Canvas API provides a means for drawing graphics via JavaScript and the HTML <canvas> element. Among other things, it can be used for animation, game graphics, data visualization, photo manipulation, and real-time video processing.
Taped Together, June 25, 2021
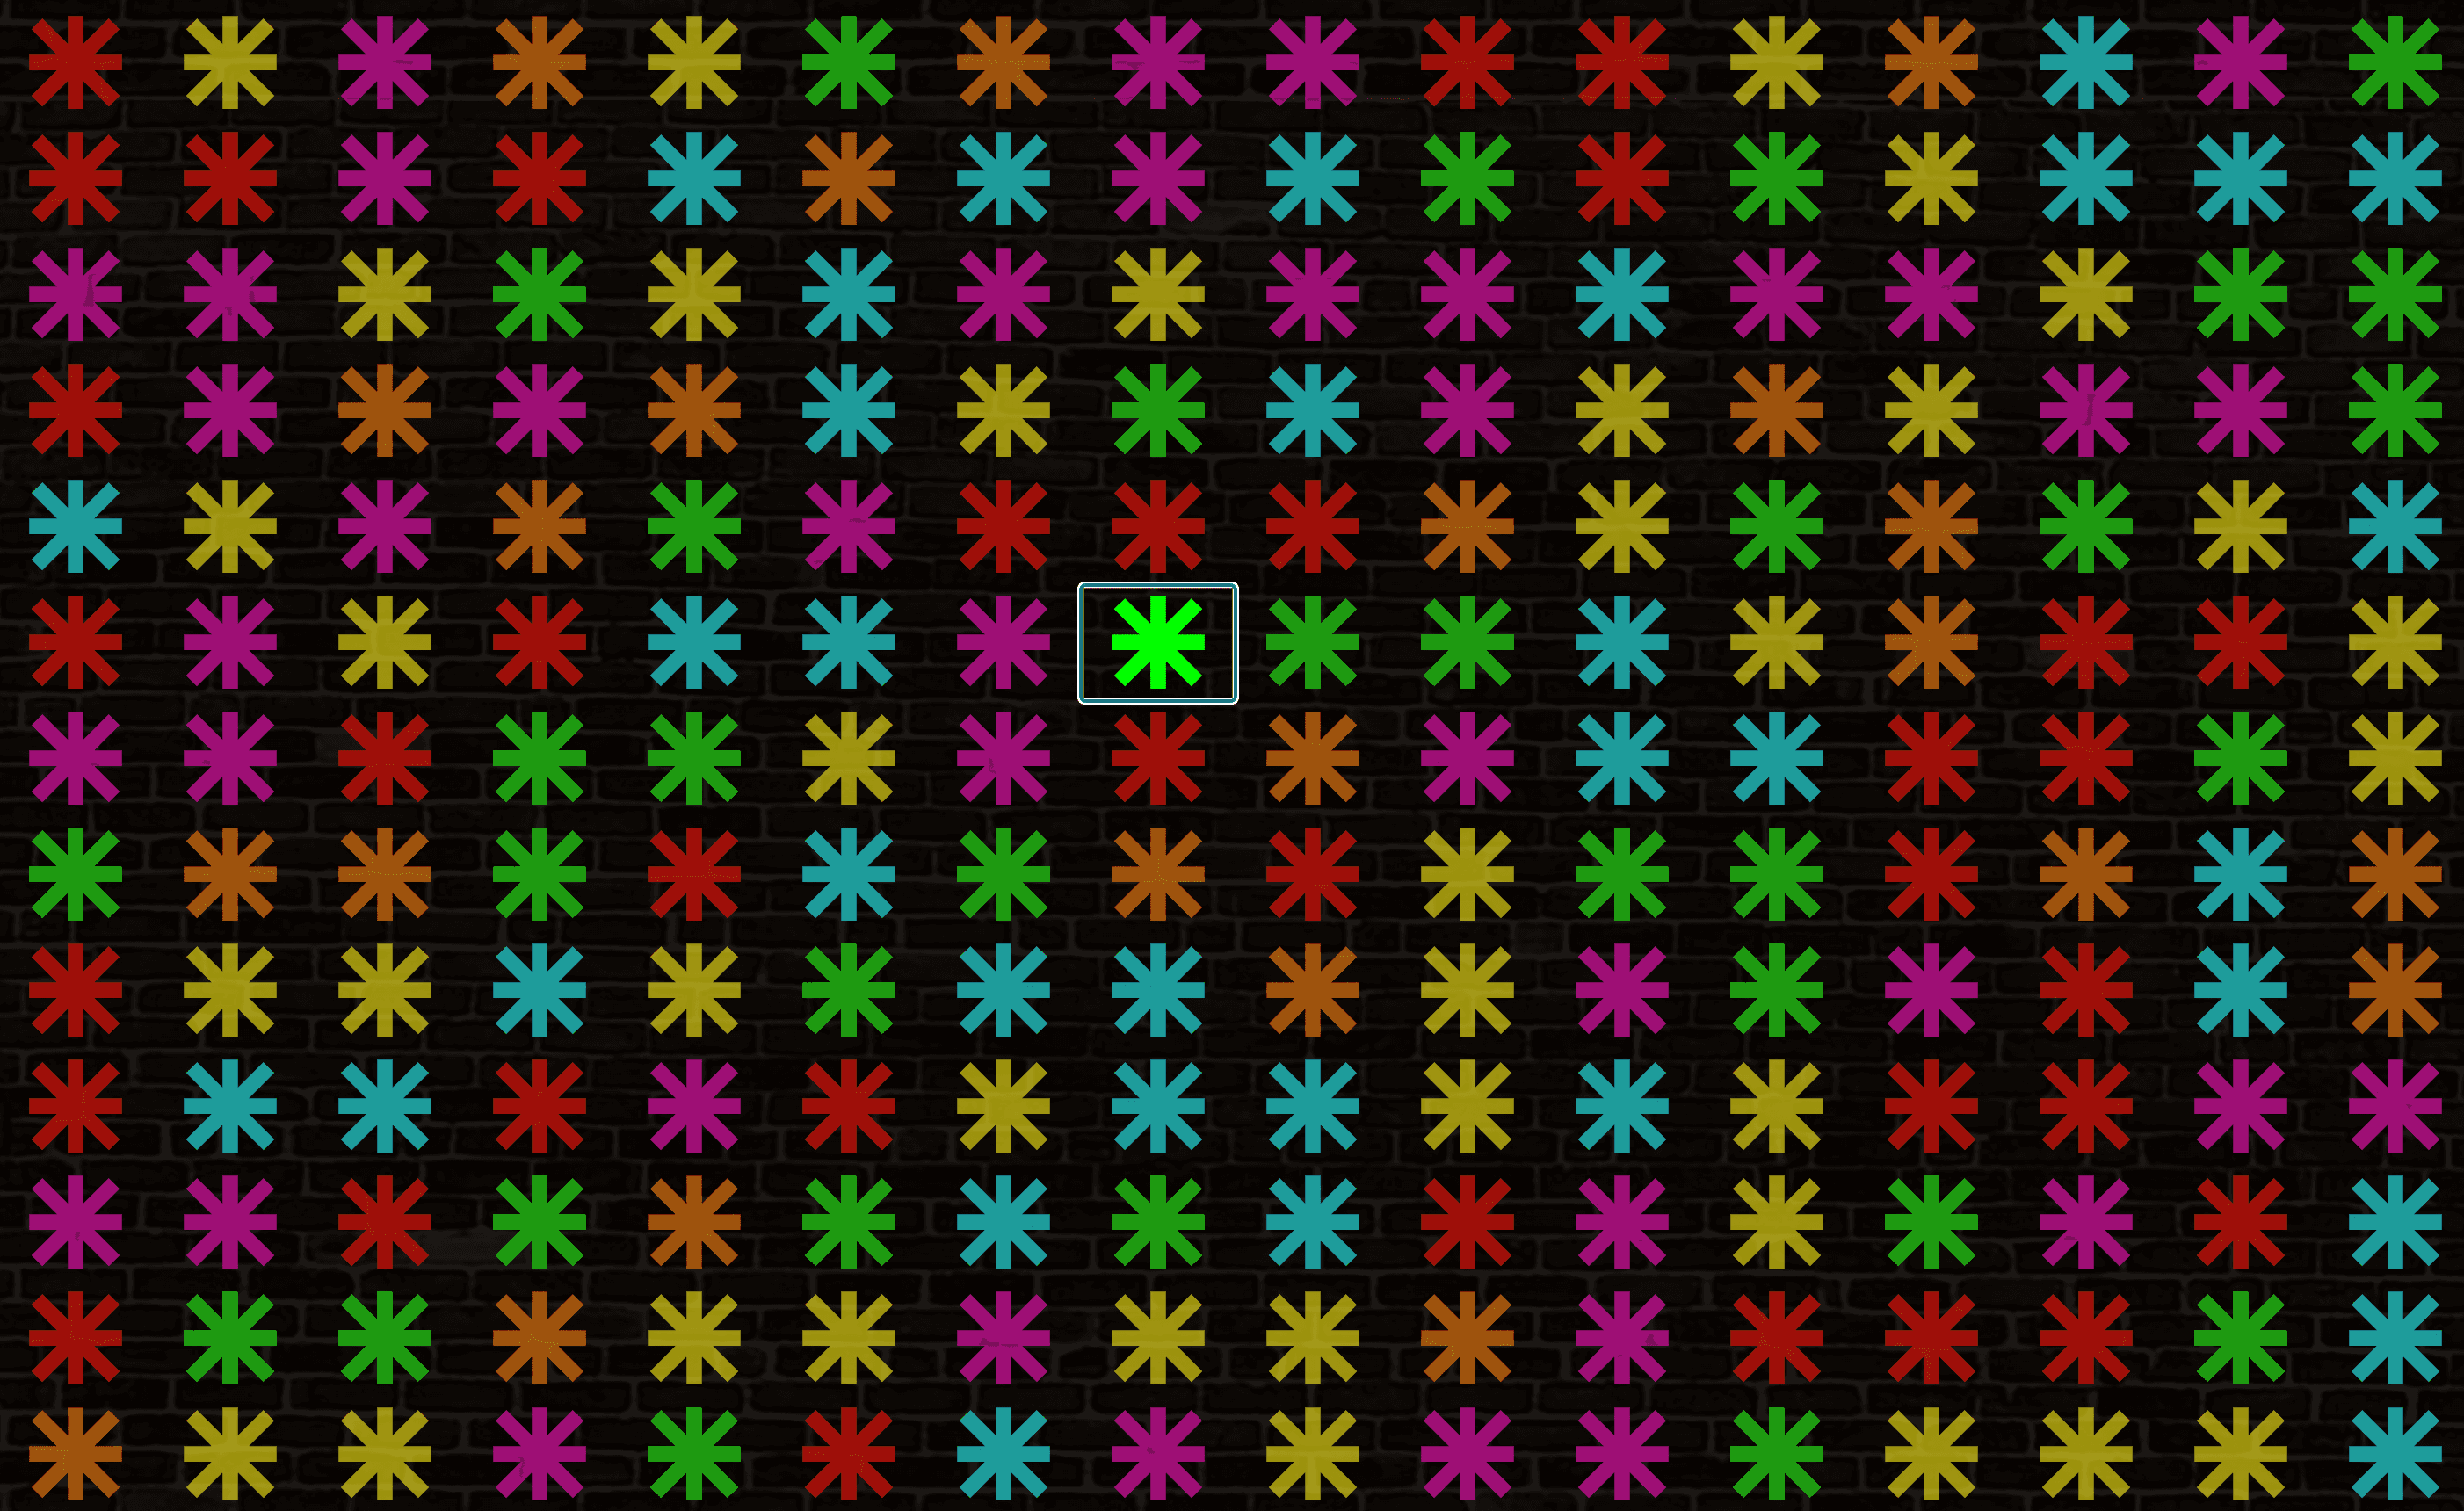
Taped Together was a collection of publicly submitted responses to the prompt "I am getting vaccinated because...". It is inspired by the work of artist Mark Reinhart’s duct tape graffiti on city buildings, who during the COVID-19 pandemic connected the community with bright coloured messages of…
Between the Sand - Phase 3 - Online Exhibition, December 05, 2020
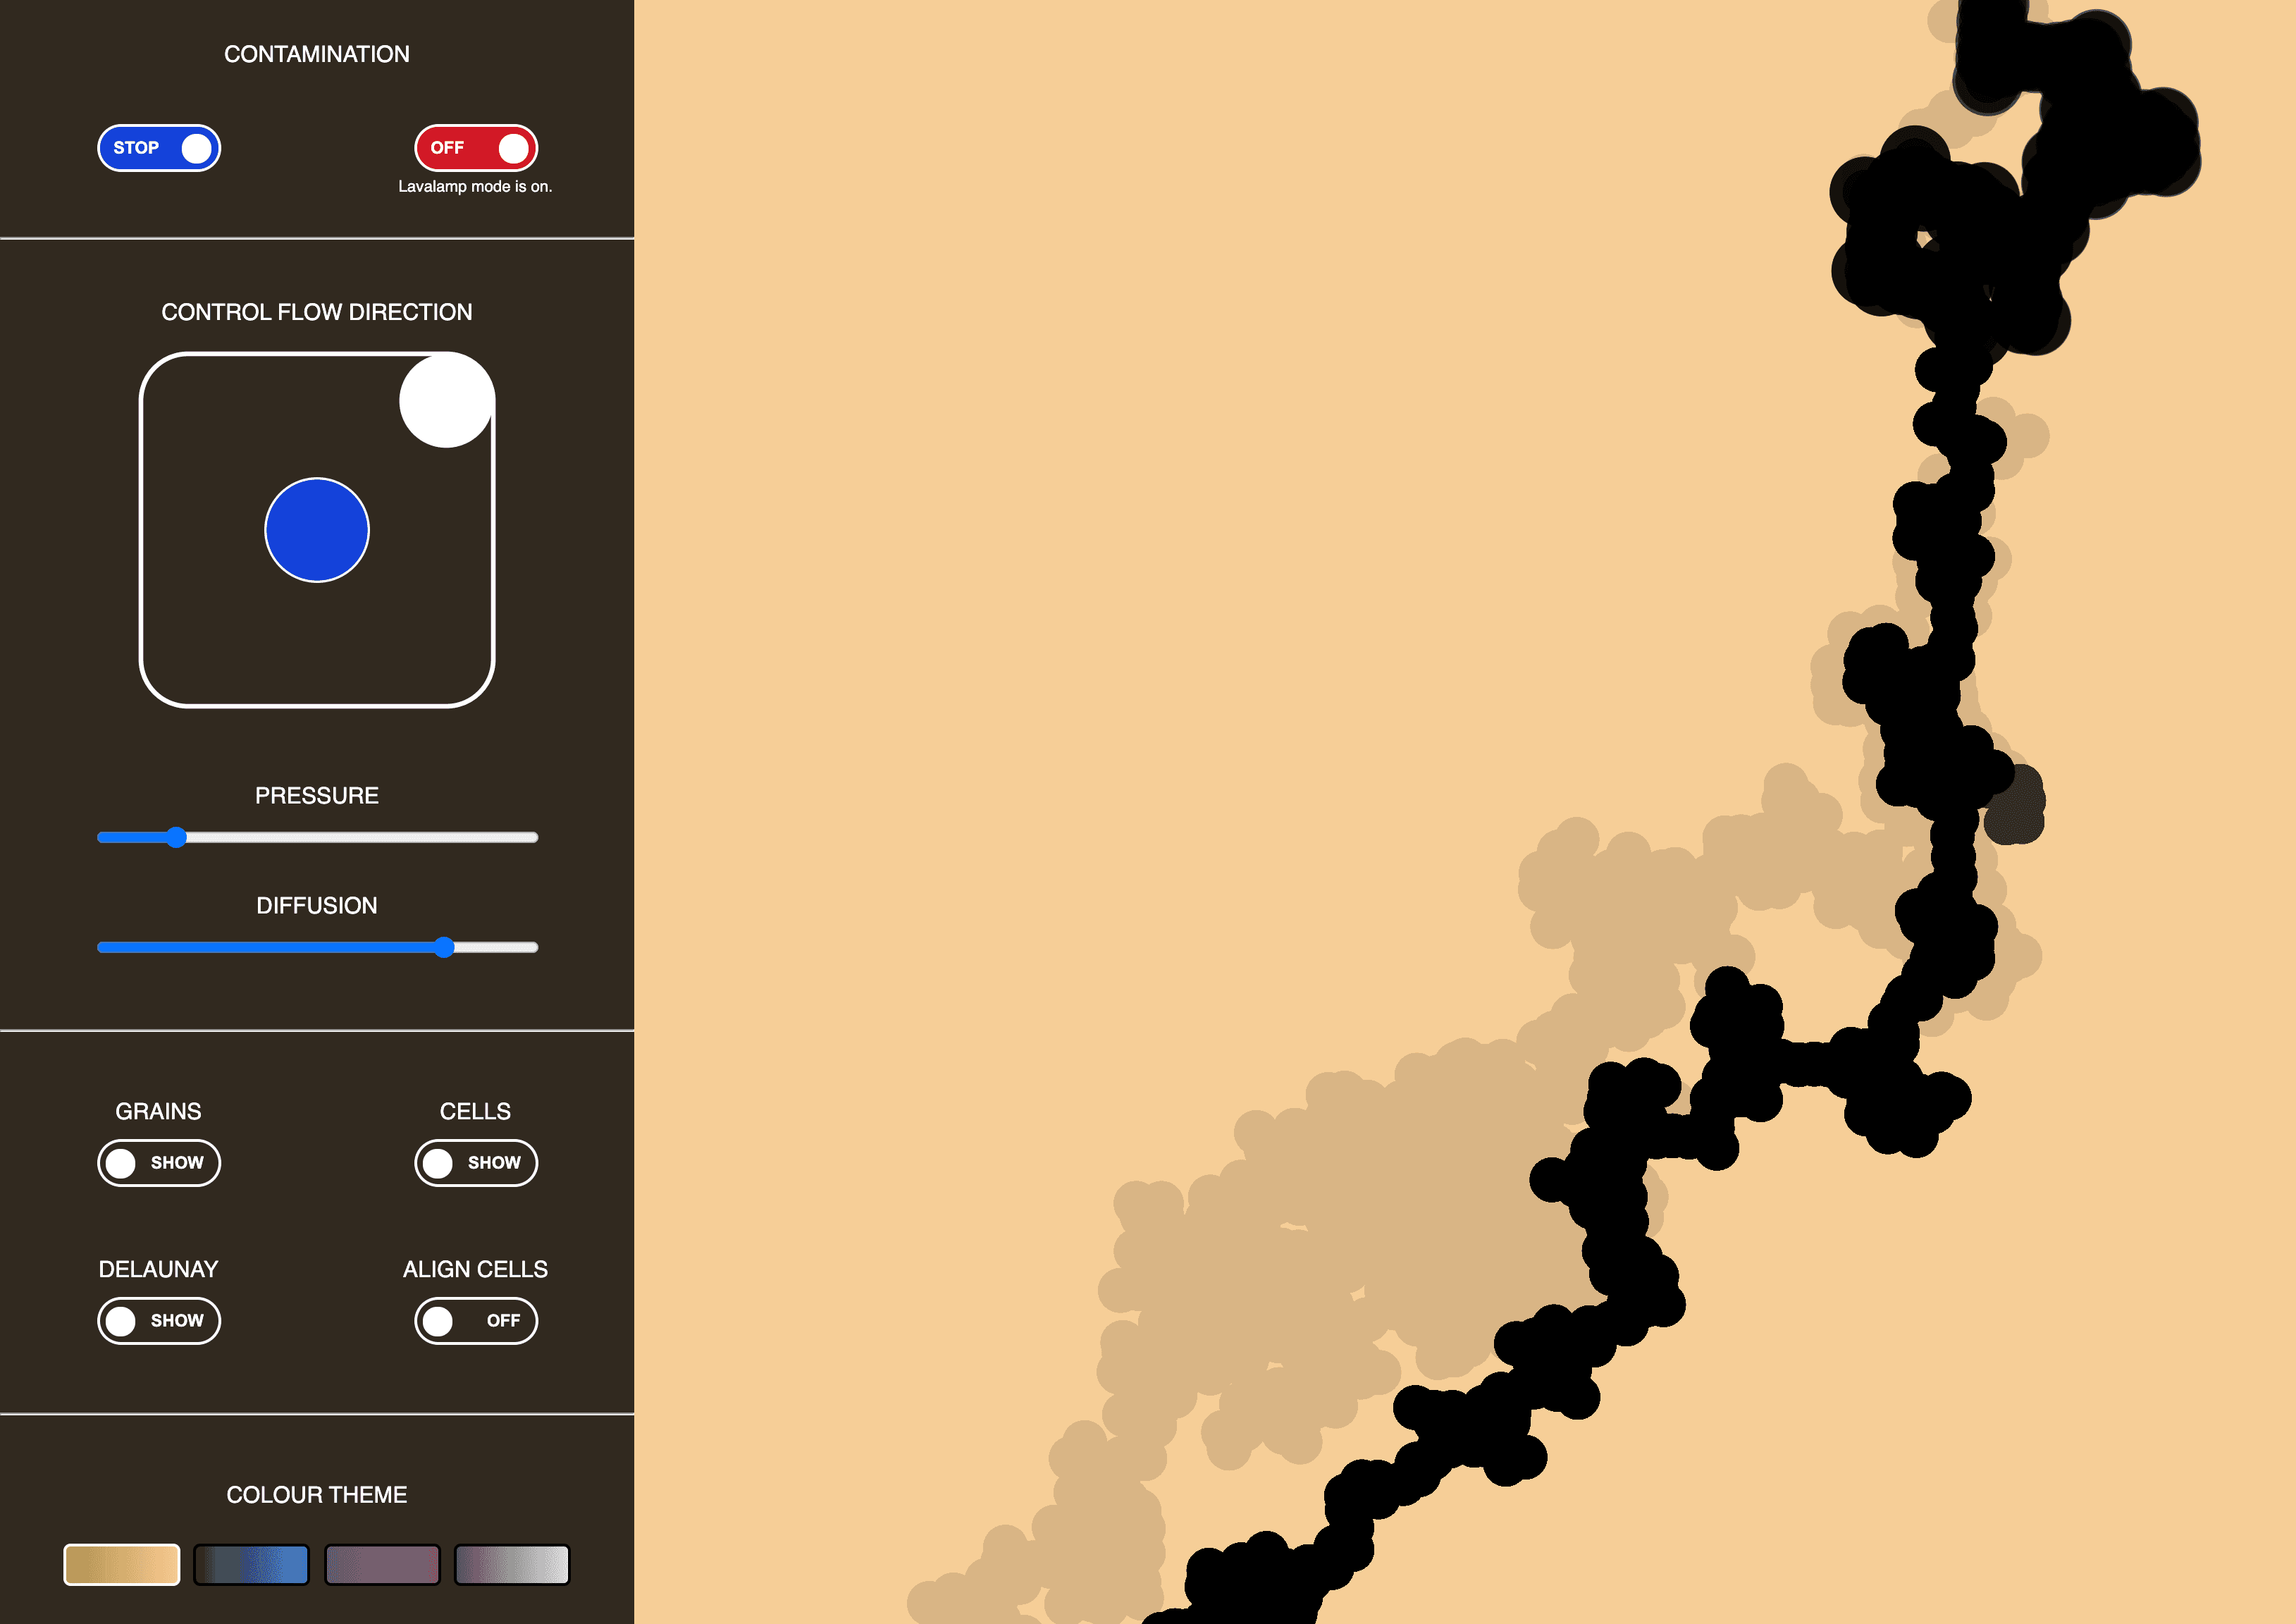
The third and final phase of Between the Sand is an interactive web application that premiered in Art the Science's Polyfield Gallery on December 5th, 2020 to coincide with World Soil Day. To create this, the web application from Phase 2 was expanded and optimized. An Explore tab was added where one…
January, Who is Bruce Kauffman?, March 01, 2019
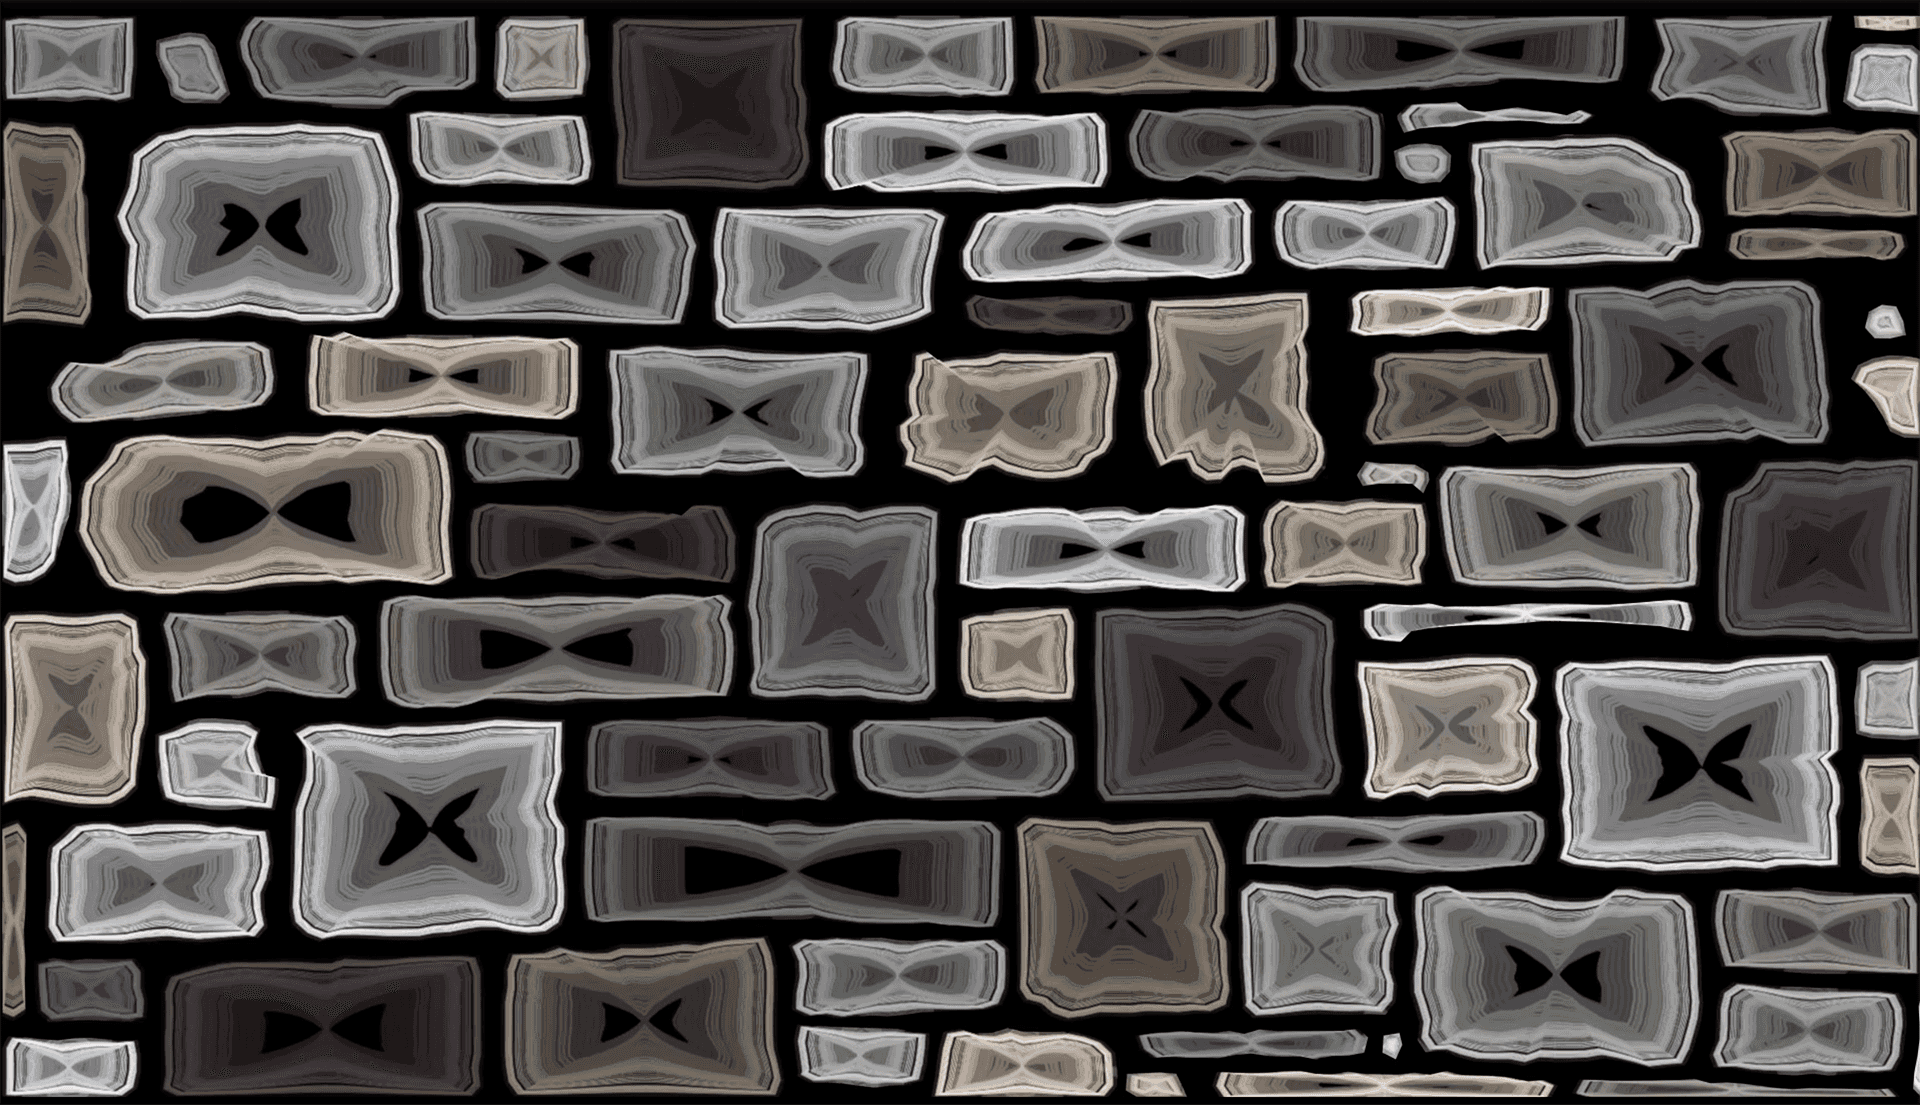
Based on the poem January by Sadiqa Khan, January is a visual exploration of a fox's imagined journey through the Davis Tannery Lands, a 37 acre brownfield site on the shore of the Rideau River in Kingston, Ontario. The poem was read by Sadiqa Khan and recorded by Matt Rogalsky. The music featured…
Between the Sand - Phase 2 - Local Event, February 27, 2019
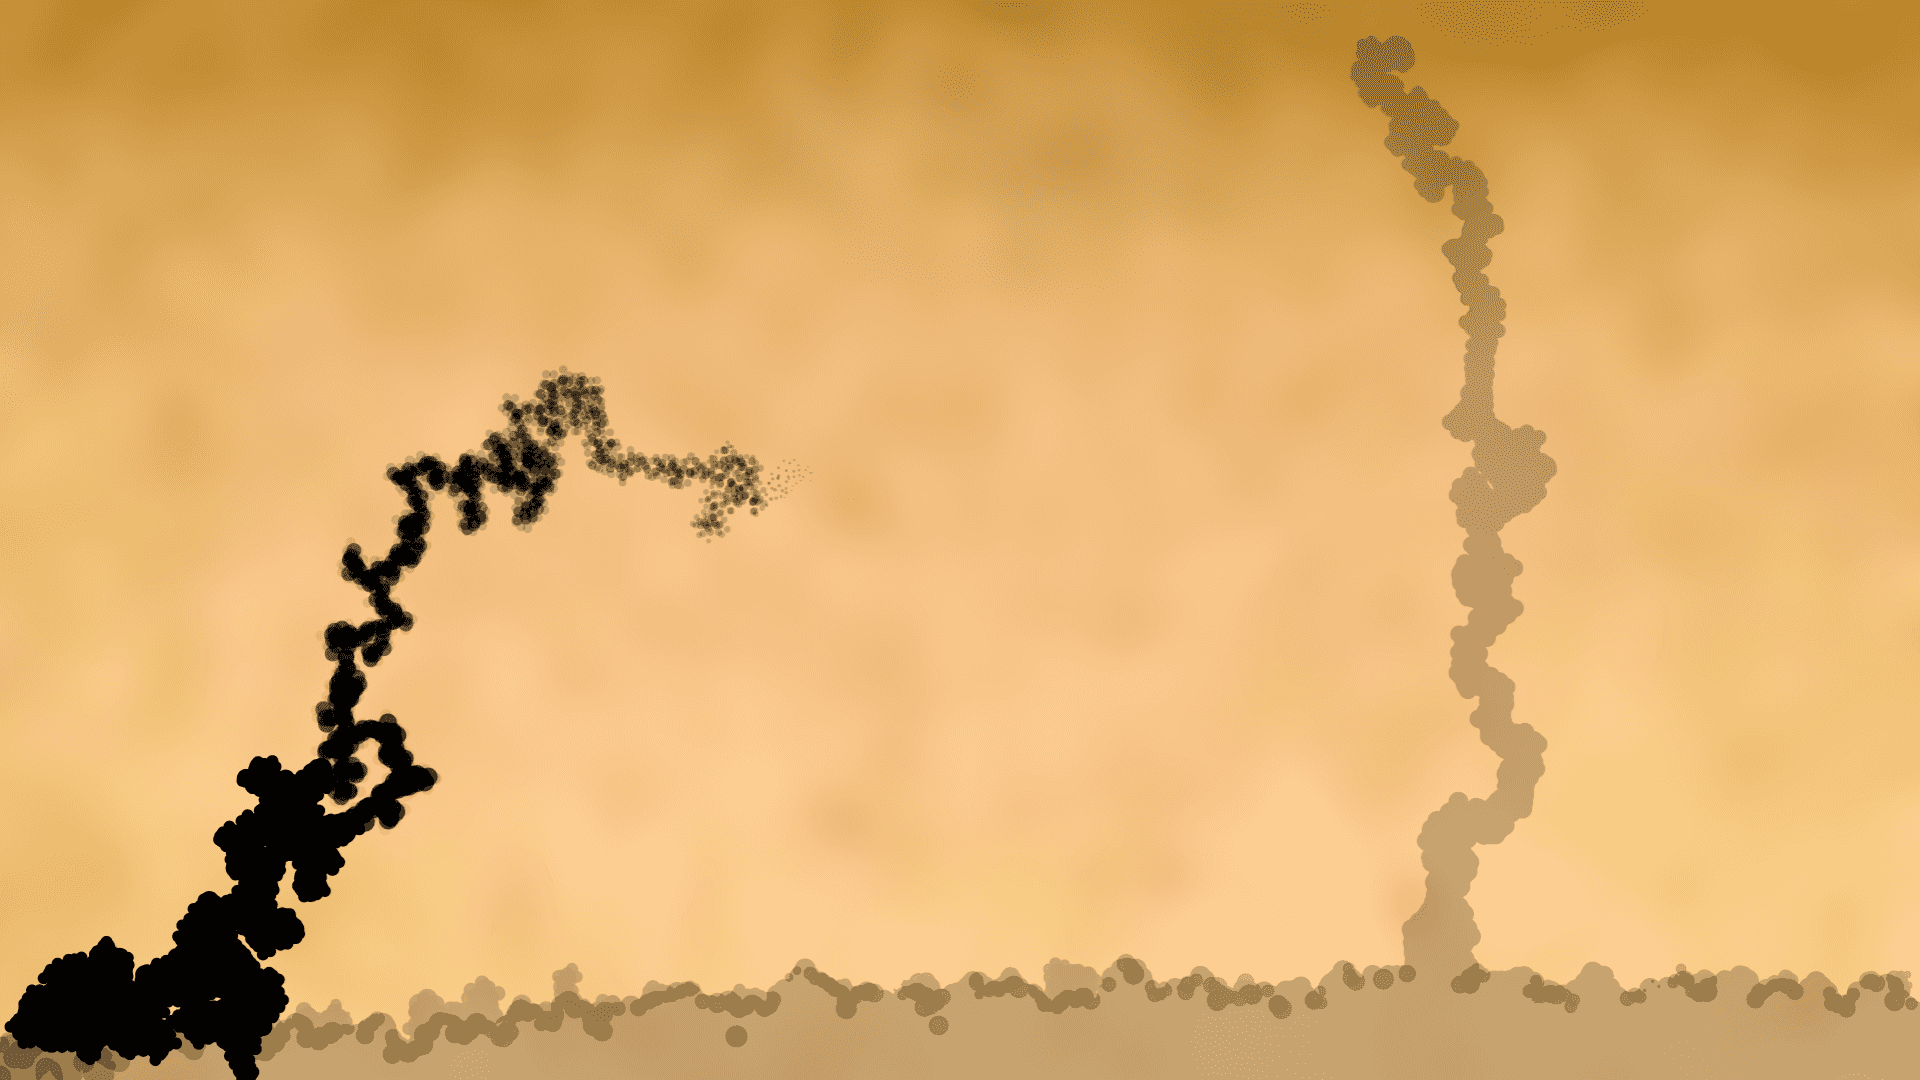
Phase 2 of the Between the Sand residency was a public installation at the Modern Fuel ARC. The work was showcased for the first time alongside the sand coloumn used in the lab. This was a chance for the local community to meet the research group, the residency organizers and the artist to disuss…
Visitations and Revisitations, August 14, 2018
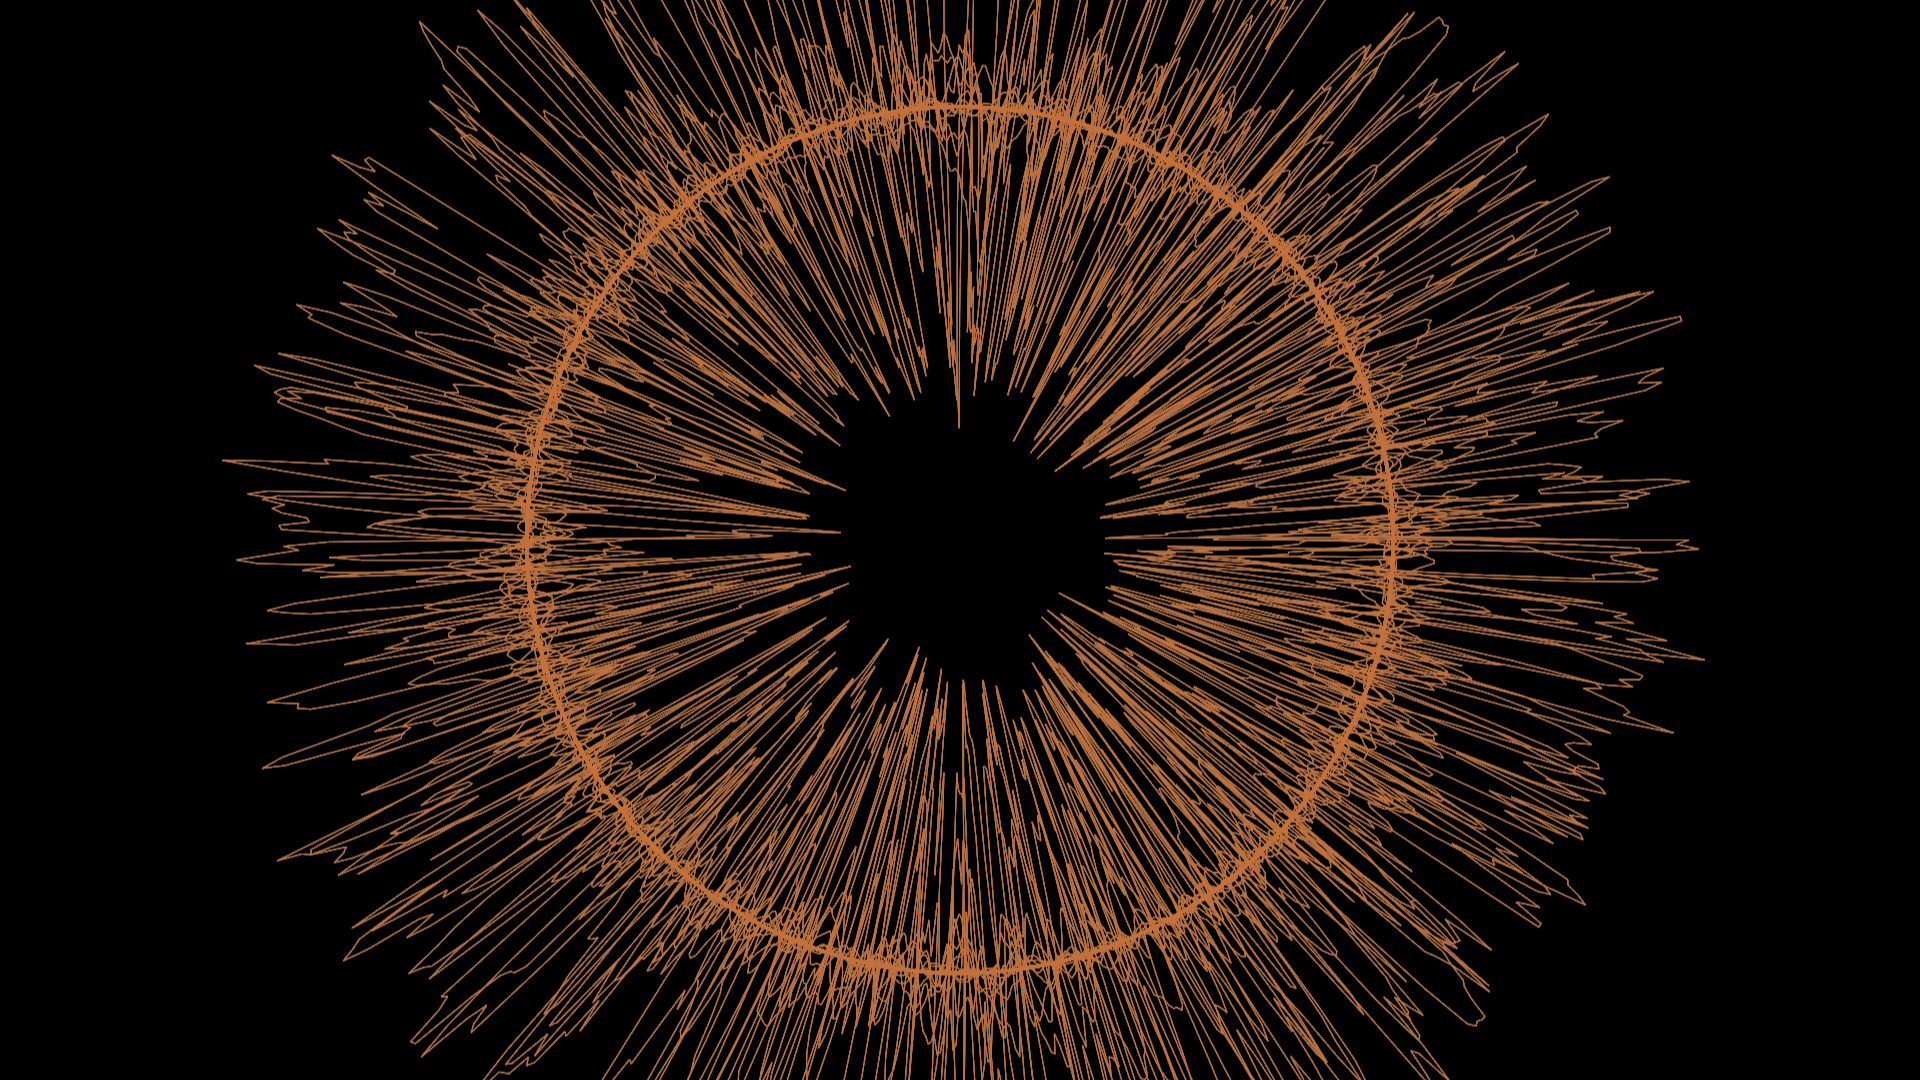
Visitations and Revisitations is a series of four pieces by Matt Rogalsky, that was performed live at the Isabel Bader Centre for the Performing Arts. Visuals for each performance featured a number of new algorithms including a circular representation of audio waveforms as well as several flowers…
Solstice Festival, June 24, 2018
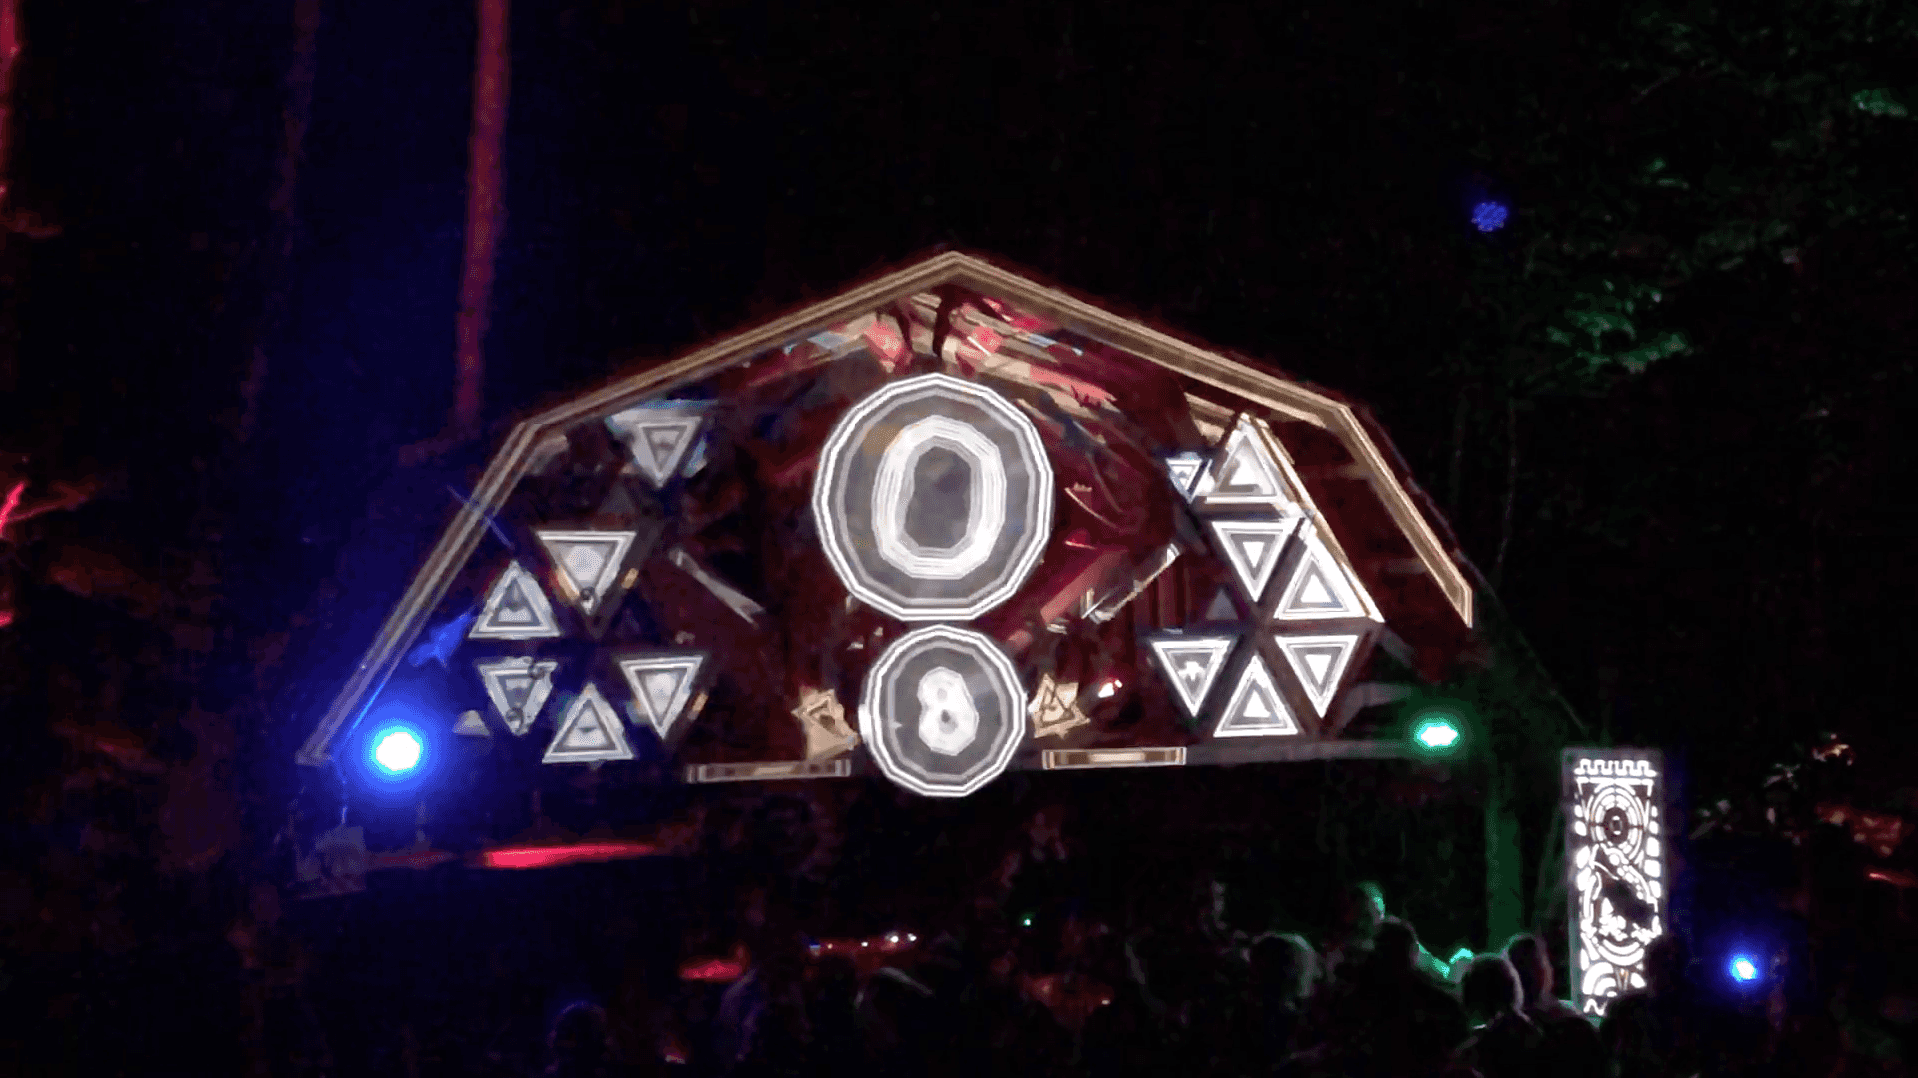
Writing custom web-based projection mapping and music visualization software is a pastime of mine. At the Summer Solstice Festival north of Toronto, the software made an all night appearance in June 2017, and then again in June 2018. As Dan Brown, one of the festival organizers for the Root Stage…
Between the Sand - Phase 1 - In the Lab, March 30, 2018
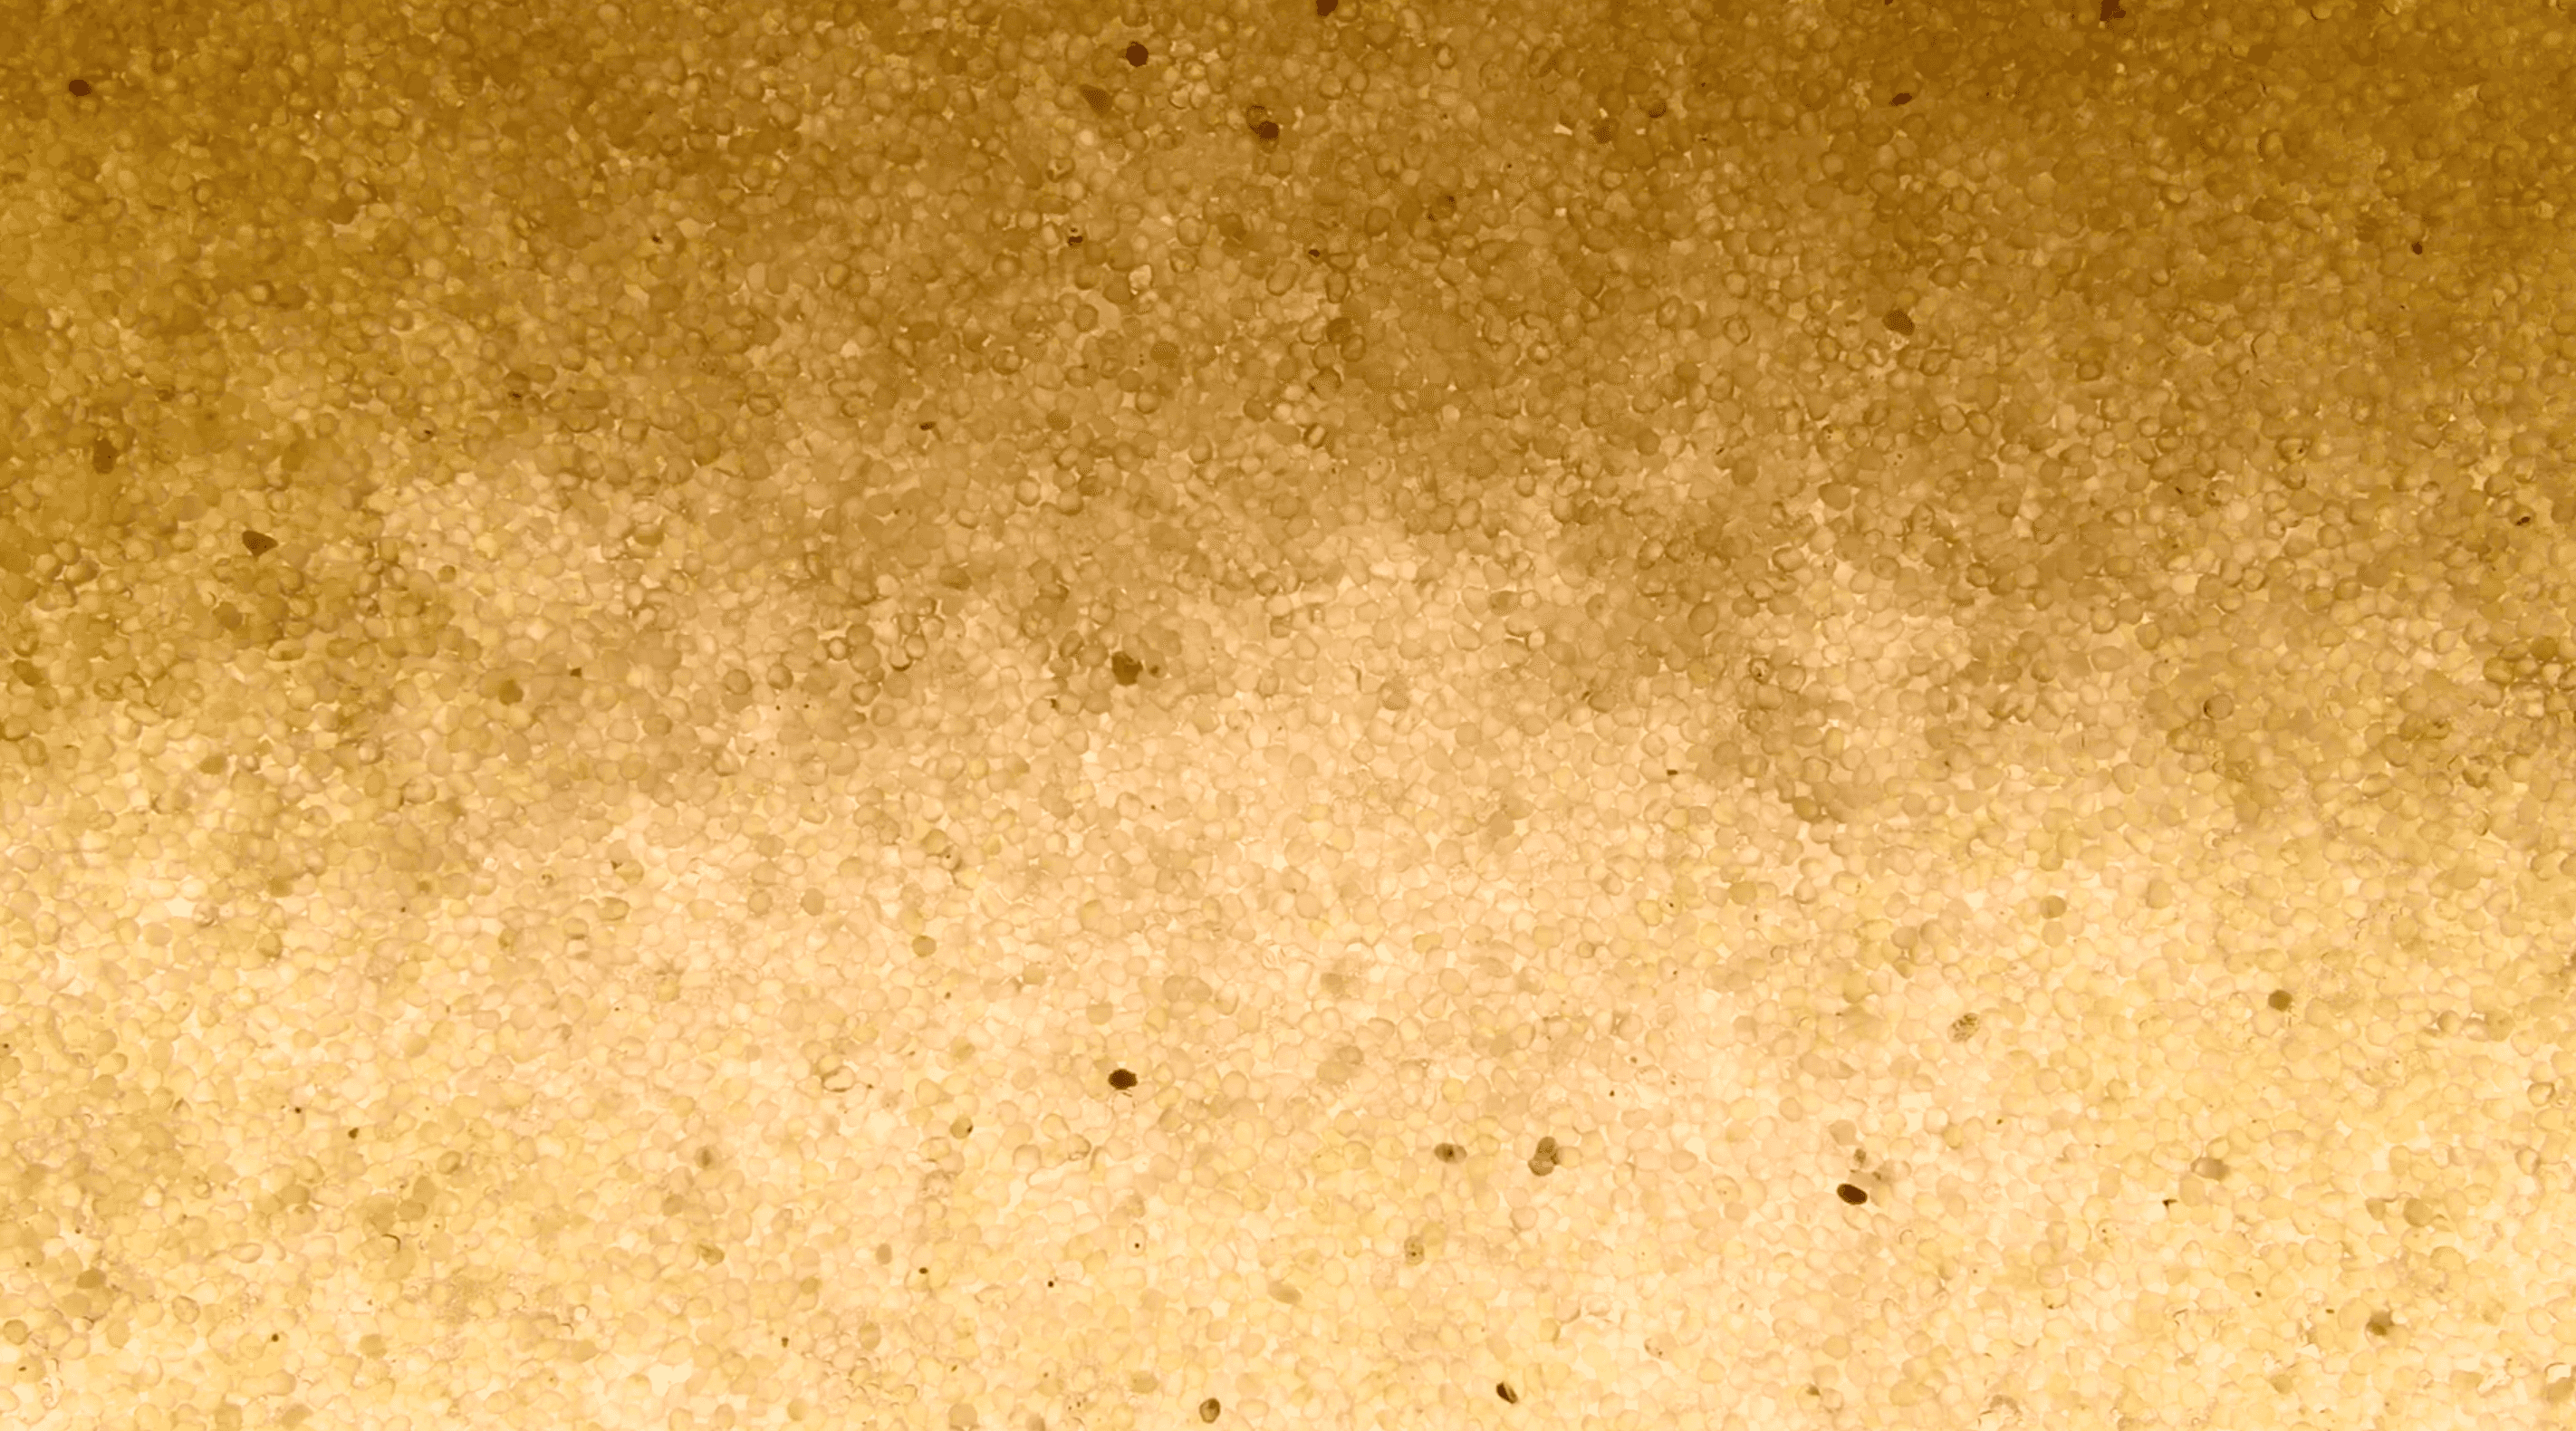
Between the Sand started as artist residency in Dr. Kevin Mumford's Research Lab at the Department of Civil Engineering at Queen's University in Kingston, Ontario, Canada. It was organized, facilitated and hosted in collaboration with Art the Science. This was an immersive residency lasting two…
Community Flow, March 13, 2018
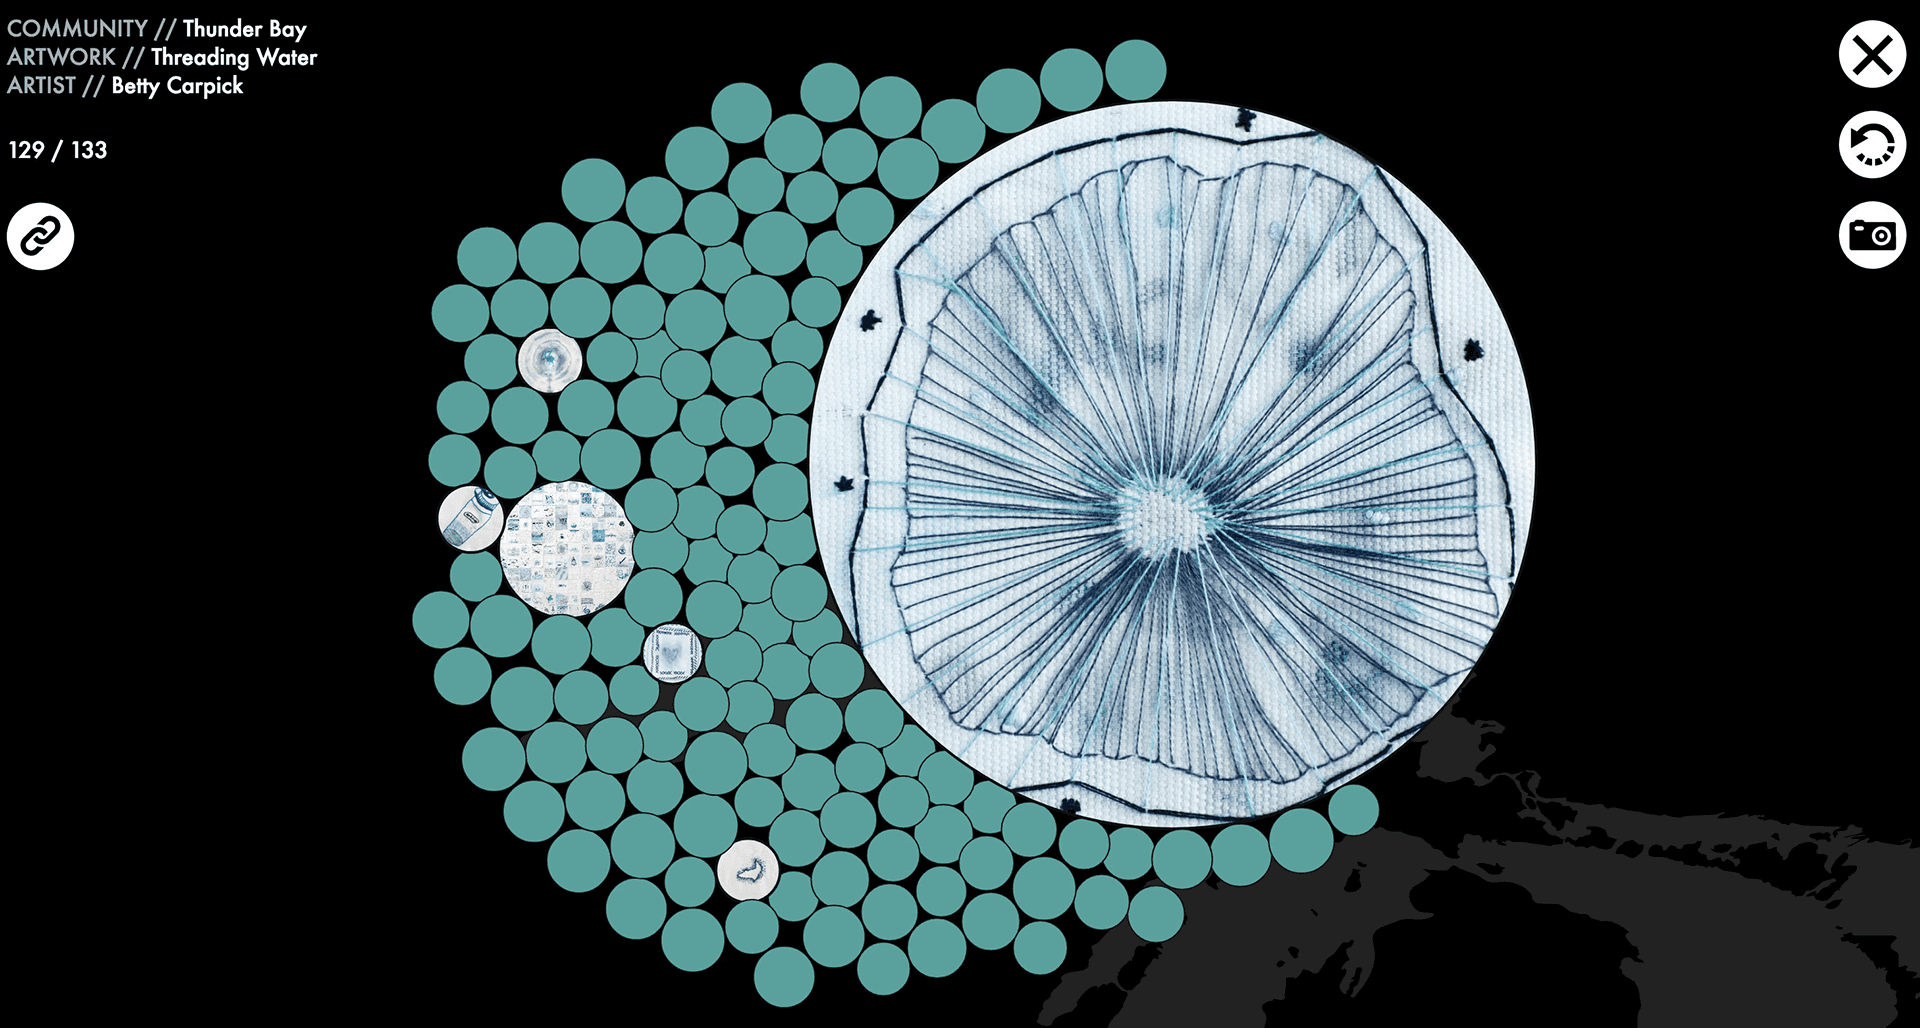
Community Flow was created to bring together artworks from eight communities on the Canadian side of the Great Lakes. Each community had an artist work alongside volunteers to create one artwork from many smaller contributions. This project was to feature each of the final artworks, as well as the…
Hyasynth Bio, January 18, 2018
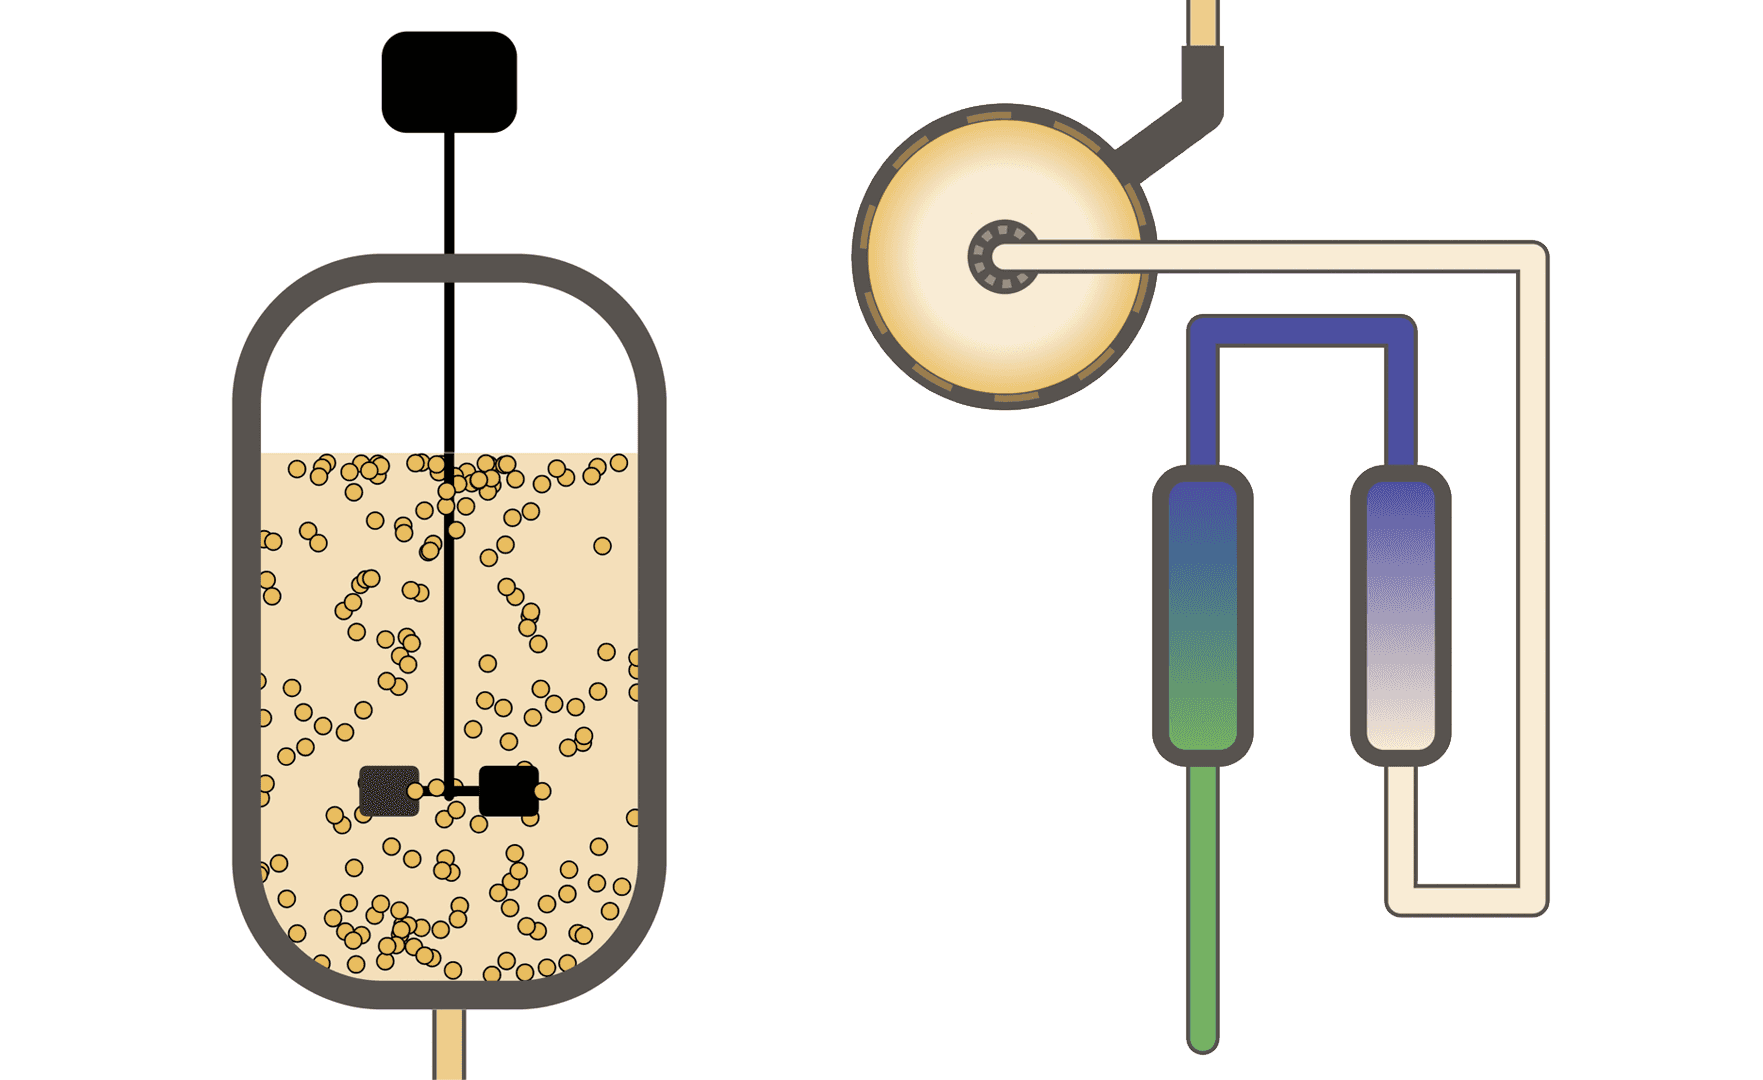
Hyasynth Bio (Montréal, QC) contacted us to see if we would be interested in describing their industrial process they use to produce synthetic cannabis. A scroll story was created that allowed visitors to their site to follow the process from raw ingredients to finished products. One of the main…
Electric Circuits (2017), April 07, 2017
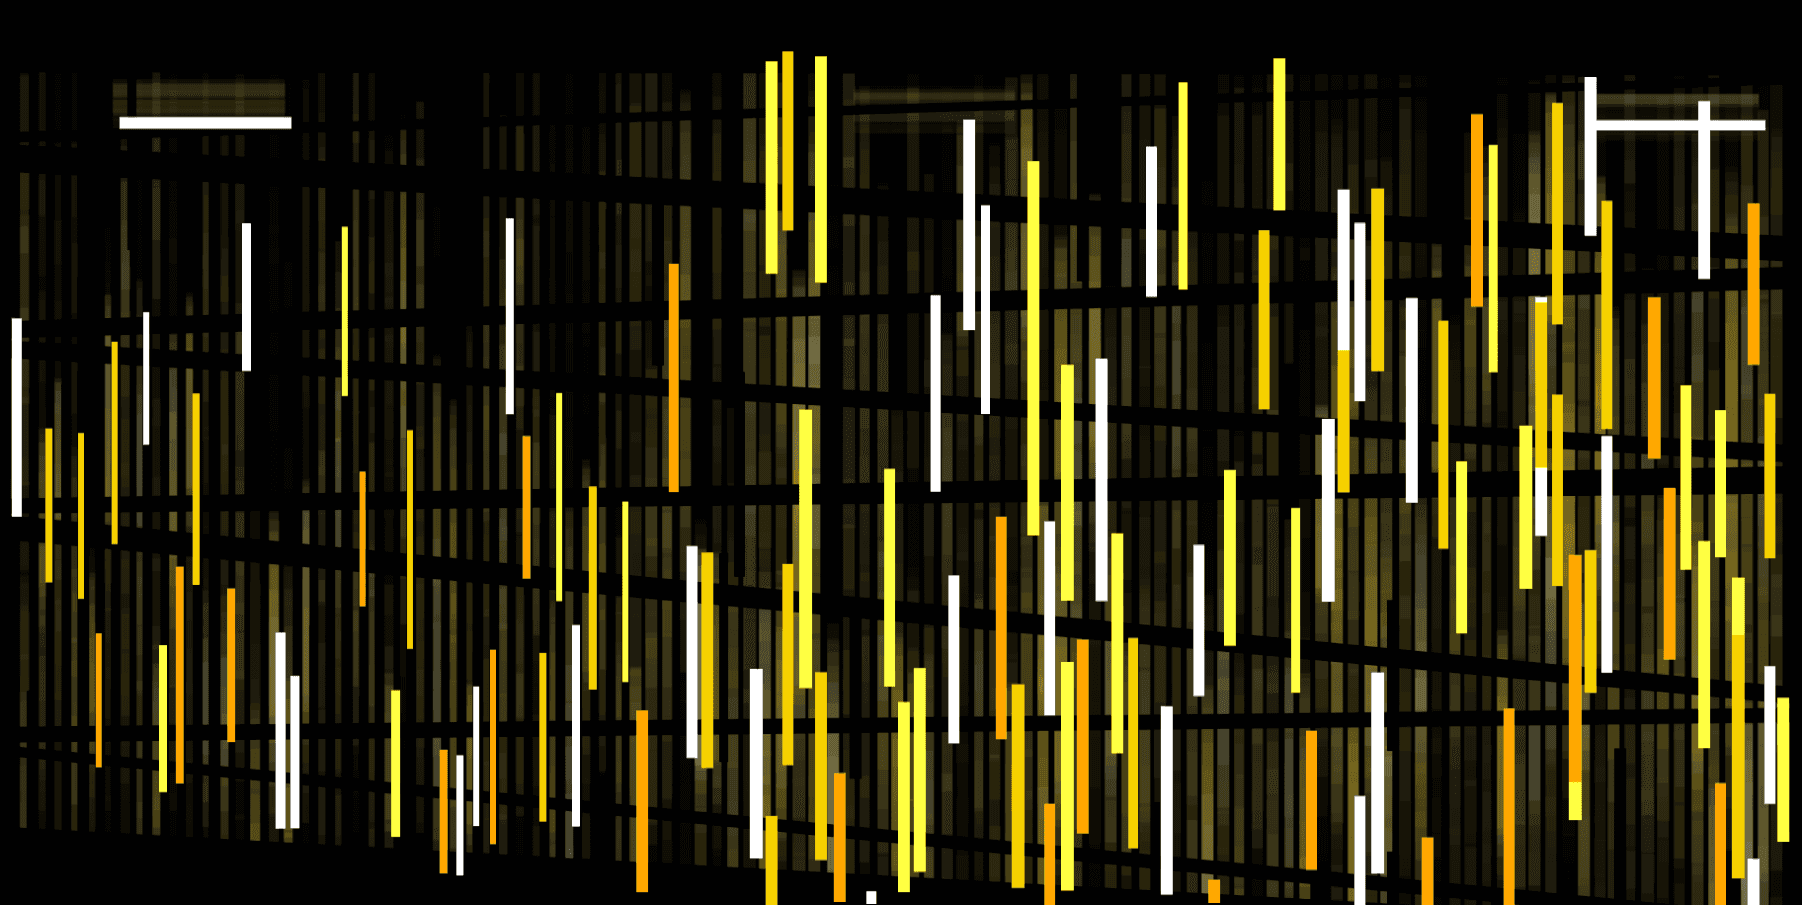
Writing custom web-based projection mapping and music visualization software is a pasttime of mine. This particular projection mapping and audio visualization project had 138 vertcial slats of wood, to be mapped at the Rehearsal Hall of the Isabel Bader Centre of Performing Arts in Kingston, Ontario…
Depth to Water, October 16, 2016
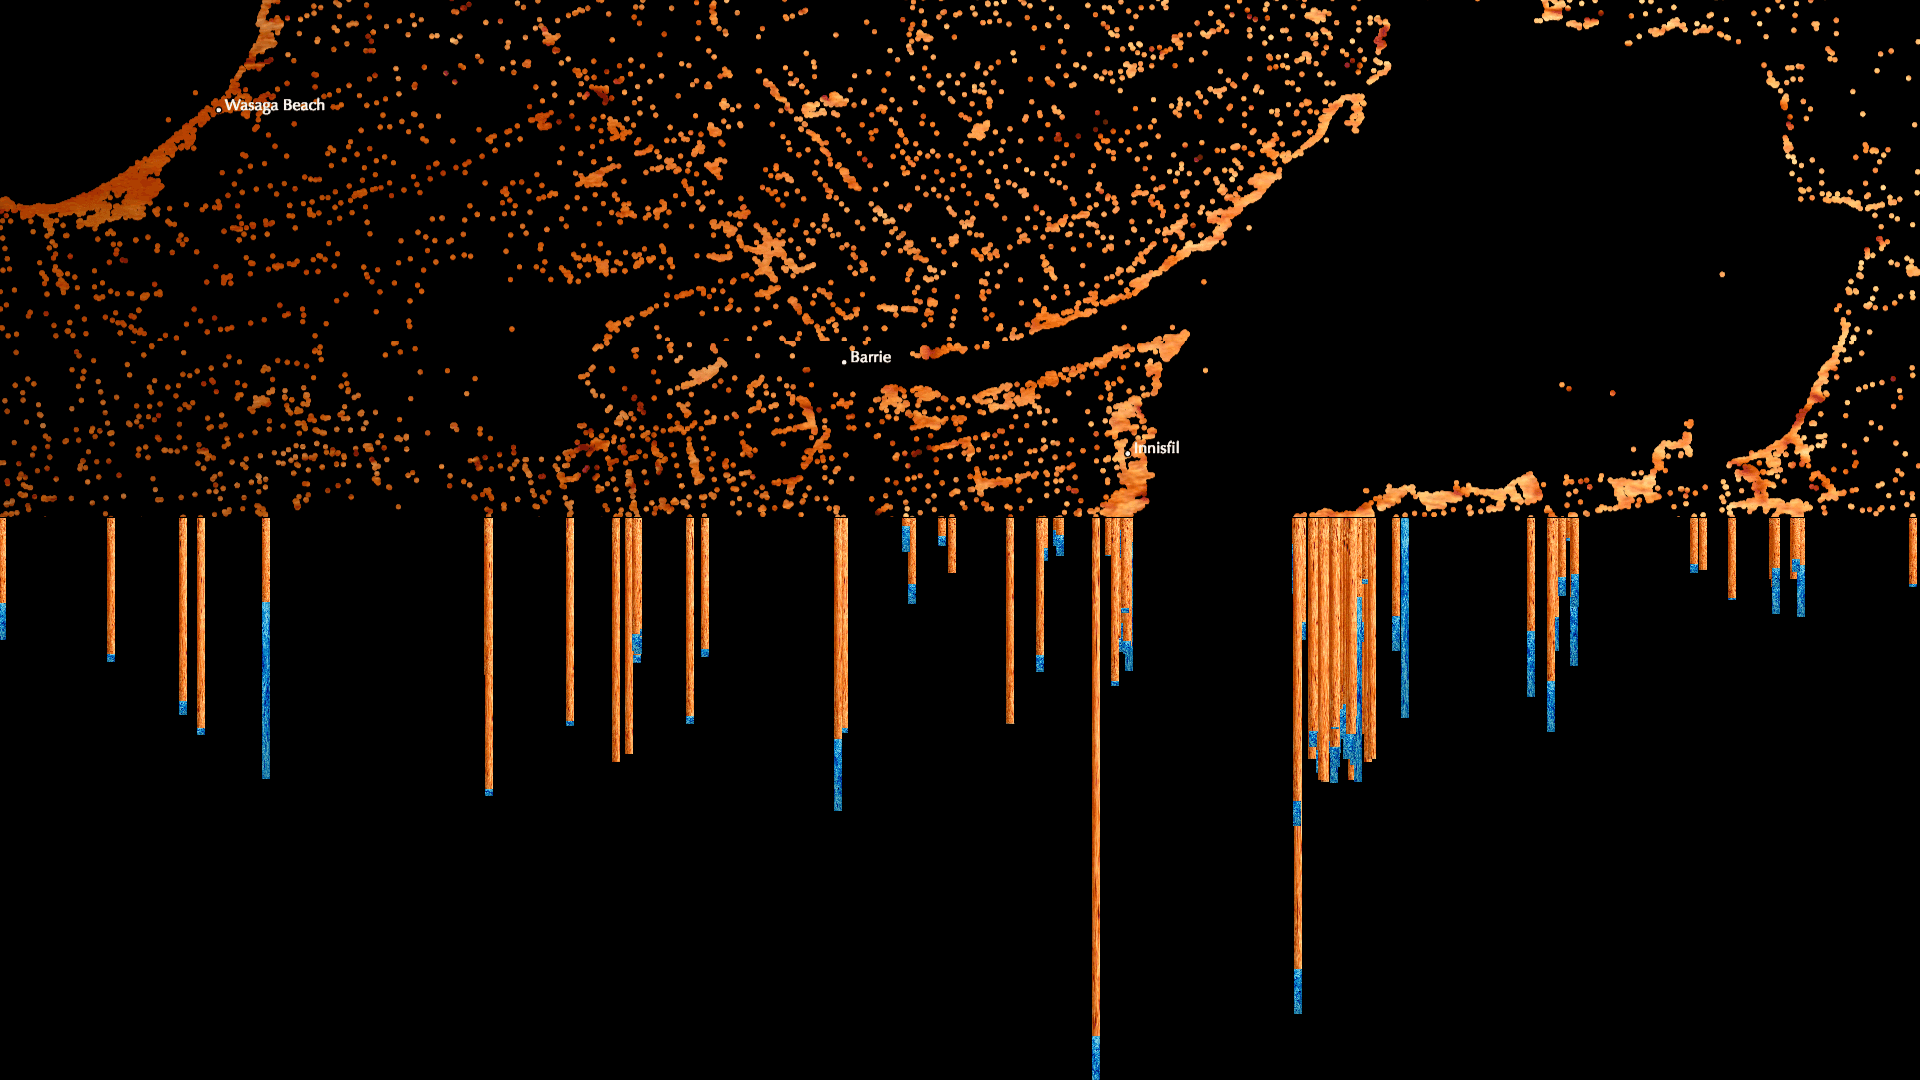
Depth to Water was created for the 17th Canadian National Conference on Drinking Water in Ottawa, Ontario to showcase how 367,089 private-well water data points can map the geography of Southern Ontario, Canada. Additionally, Depth to Water displays the depth at which water was found for each well…
Let us go then, you and I..., November 03, 2015
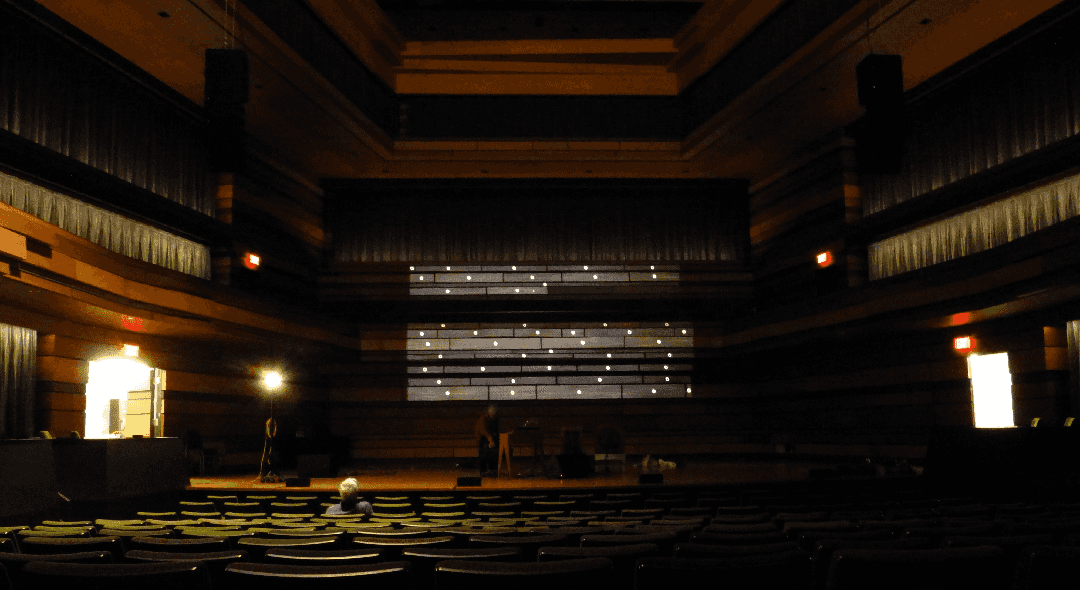
As part of Tone Deaf 14, a projection show was performed by Decomposing Pianos at the Isabel Bader Centre of Performing Arts in Kingston, Ontario. For this performance, custom code was developed to map the wooden panels behind the main stage. This software went on to become a versatile tool for web…
The Hollowmen, June 06, 2015
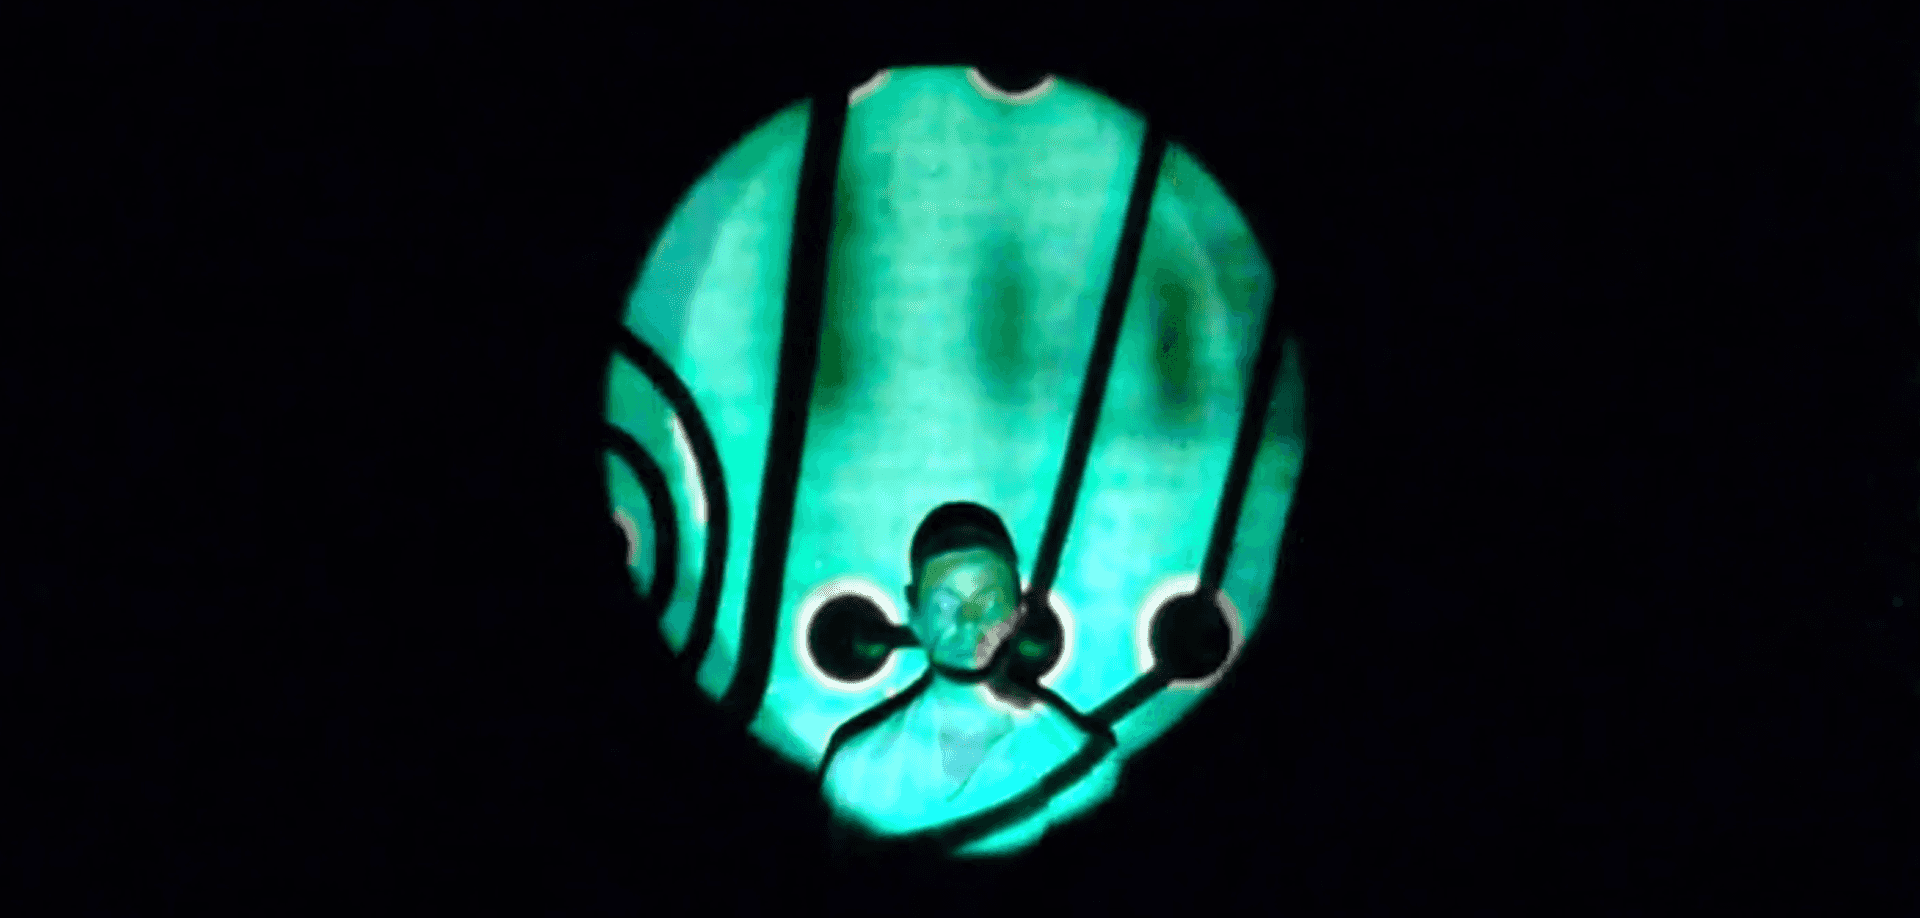
This project features T.S. Elliot's 1925 poem The Hollow Men as read in unison by a trio of computer voices. The audio was produced with an accompanying video and projected onto three dancers. It was part of Chipped Off's Waste Away, at the Black Box Studio Theatre, Isabel Bader Centre of Performing…
88 Years, Interactive, March 31, 2015
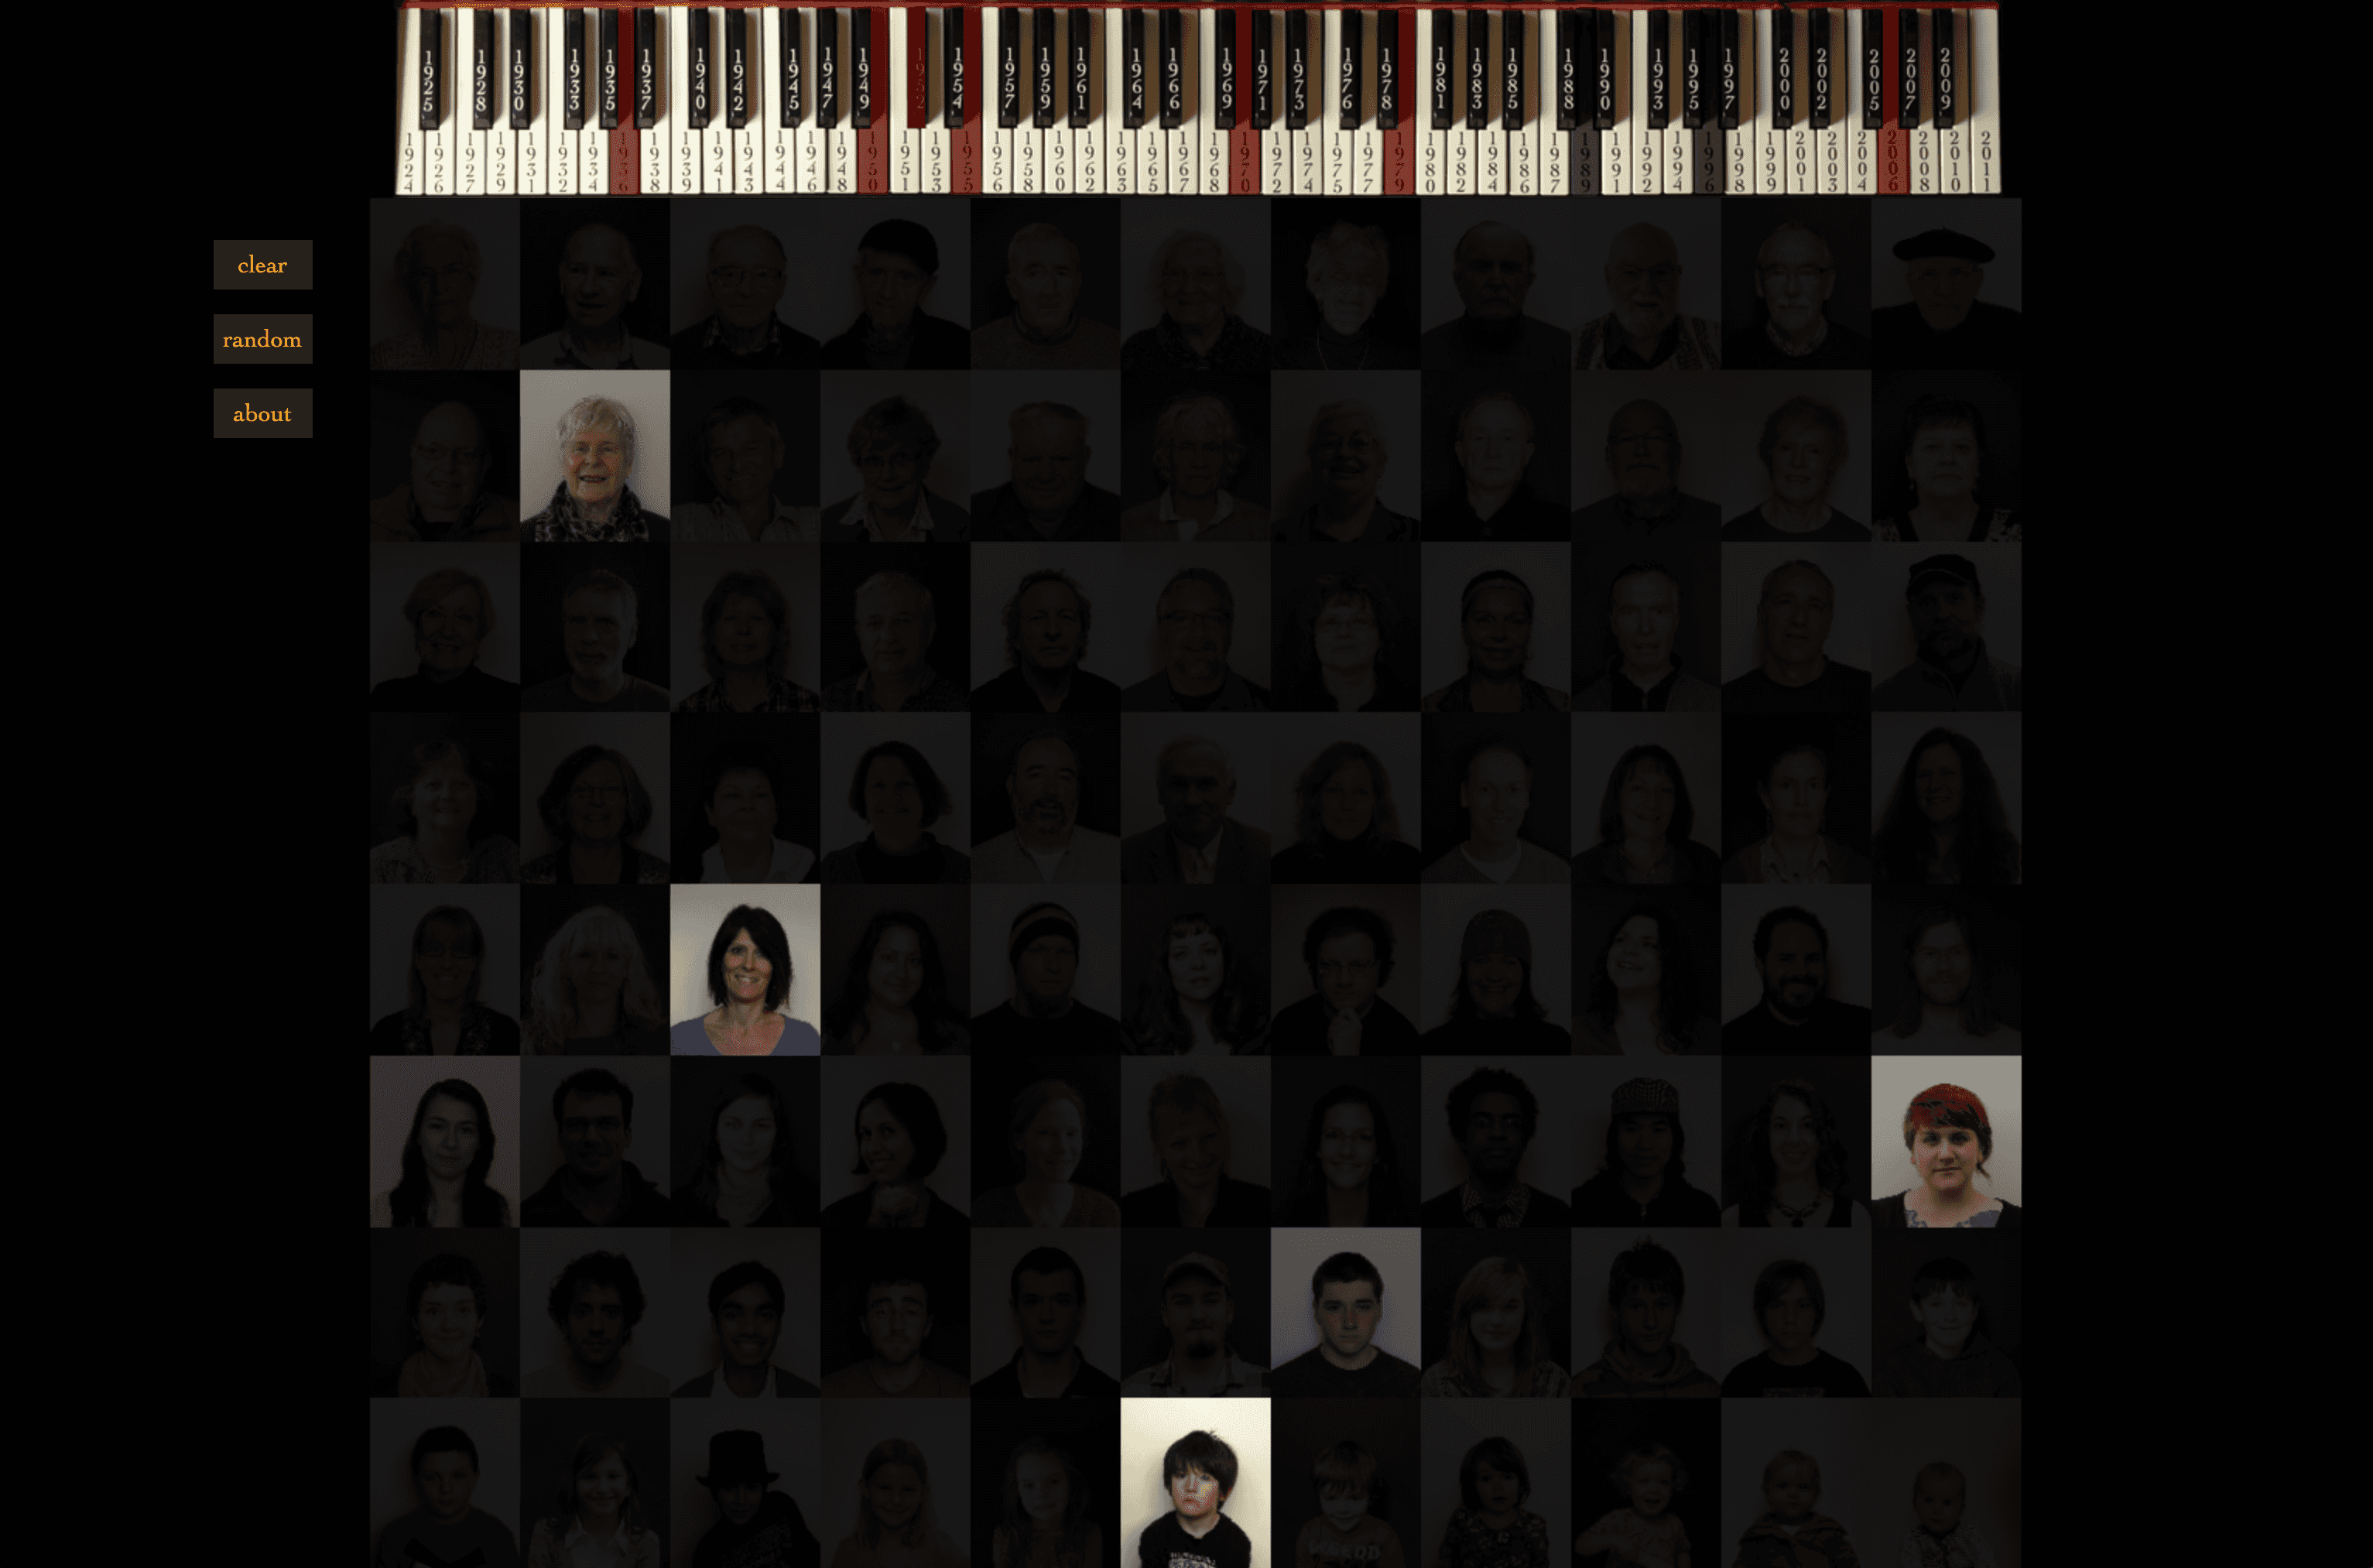
In 2011, Decomposing Pianos met and chronologically depicted 88 individuals to correspond to each key of the piano. The first twenty portraits were displayed at the State of Flux Gallery on March 26, 2011 to showcase the work in progress. The display featured groups of portraits connected to…
Regression, November 10, 2014
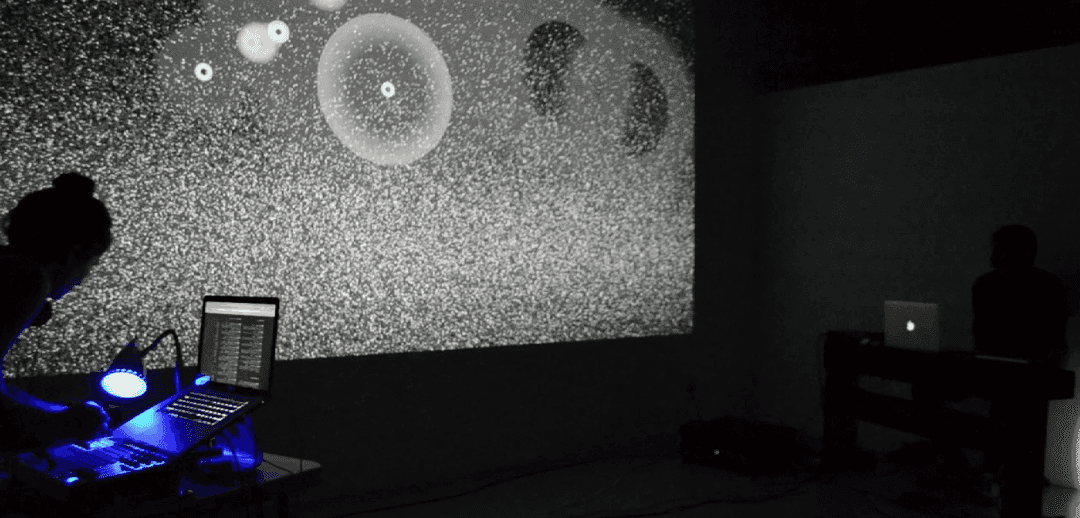
This is a live performance by Decomposing Pianos at the Modern Fuel ARC, the last show before moving from their downtown location at 21A Queen Street. This performance featured a 30 thousand pixel long cityscape rolling by under a microbial sky. The visuals were operated by a QWERTY keyboard, with…
Intersection, September 05, 2014
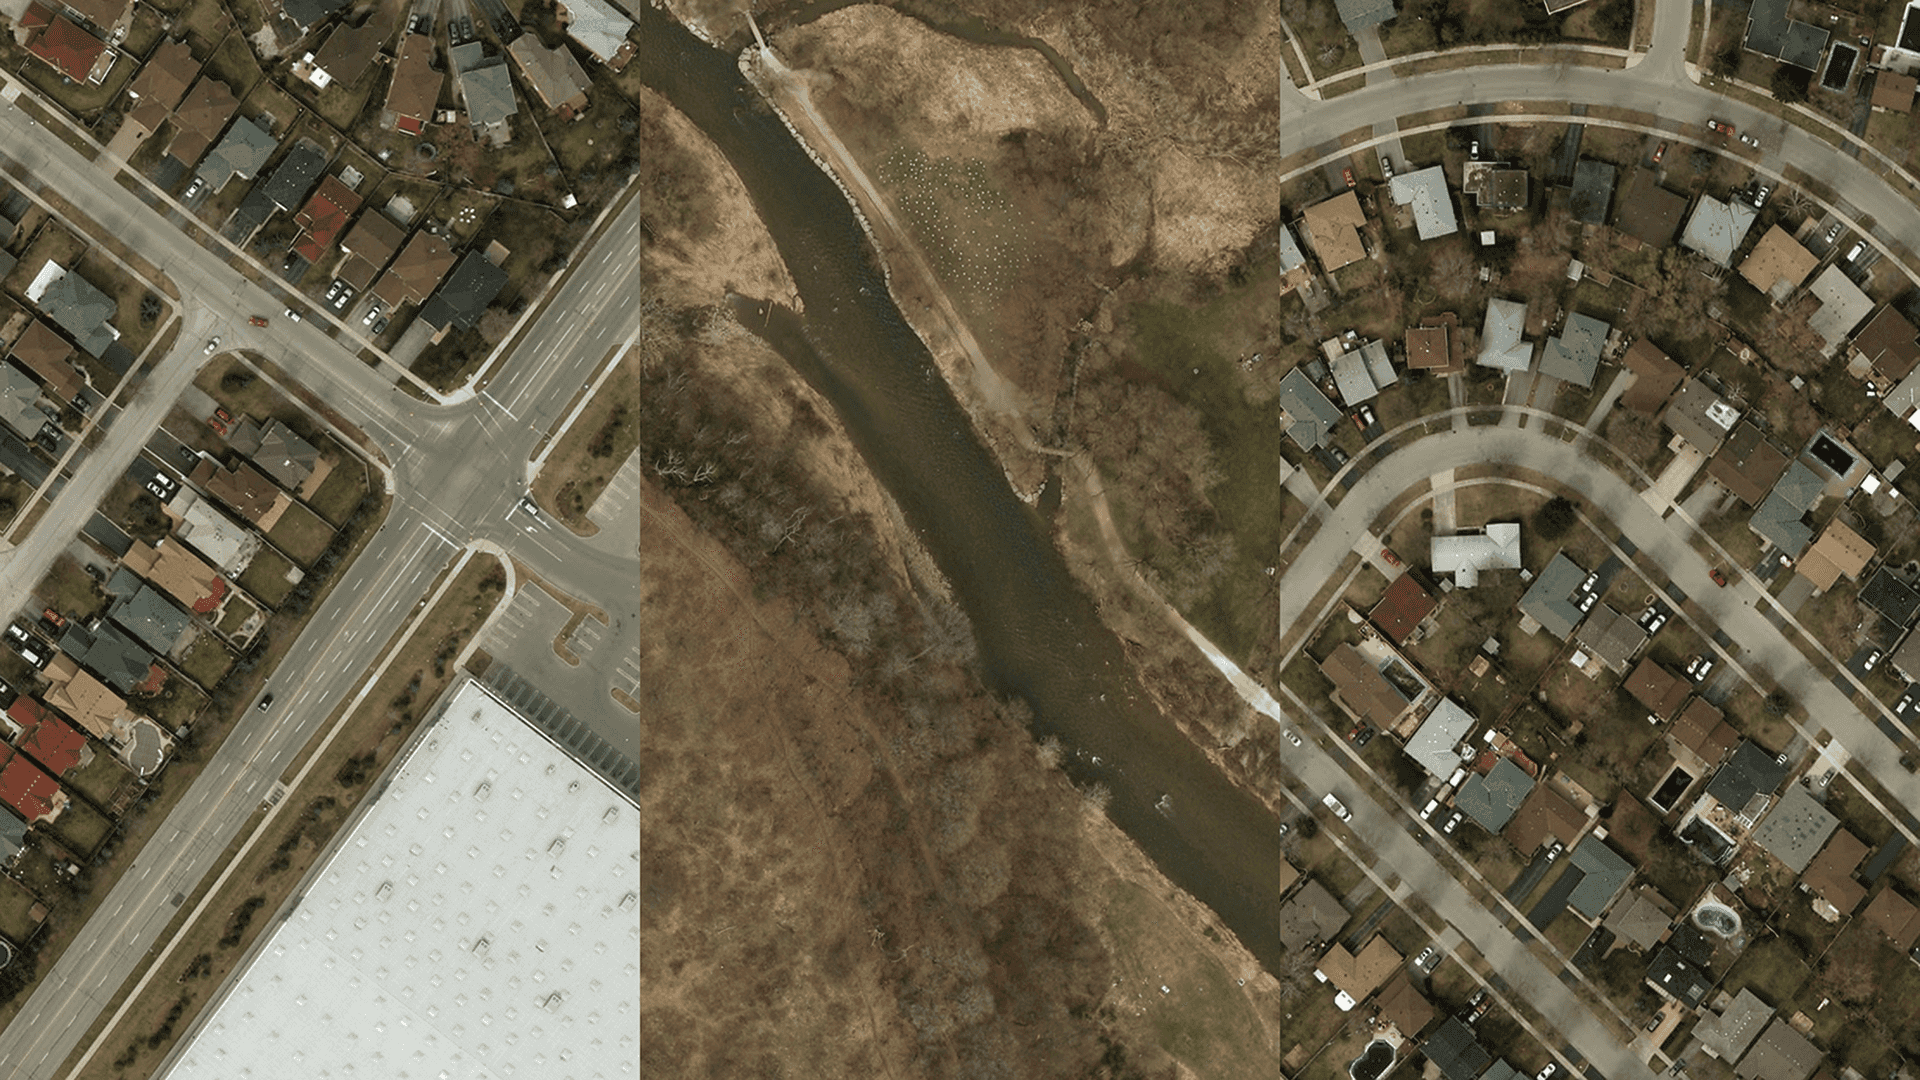
Originally created for an exhibition with the Agitated Plovers Salon, Intersection went on to win the Canadian Urbanism Award at the Toronto Urban Film Festival (TUFF) in September 2014, and was subsequently displayed across Toronto Subway stations in May 2015. Randomly displaying images from a set…
HTML5 Visualizer with MIDI Input, August 01, 2014
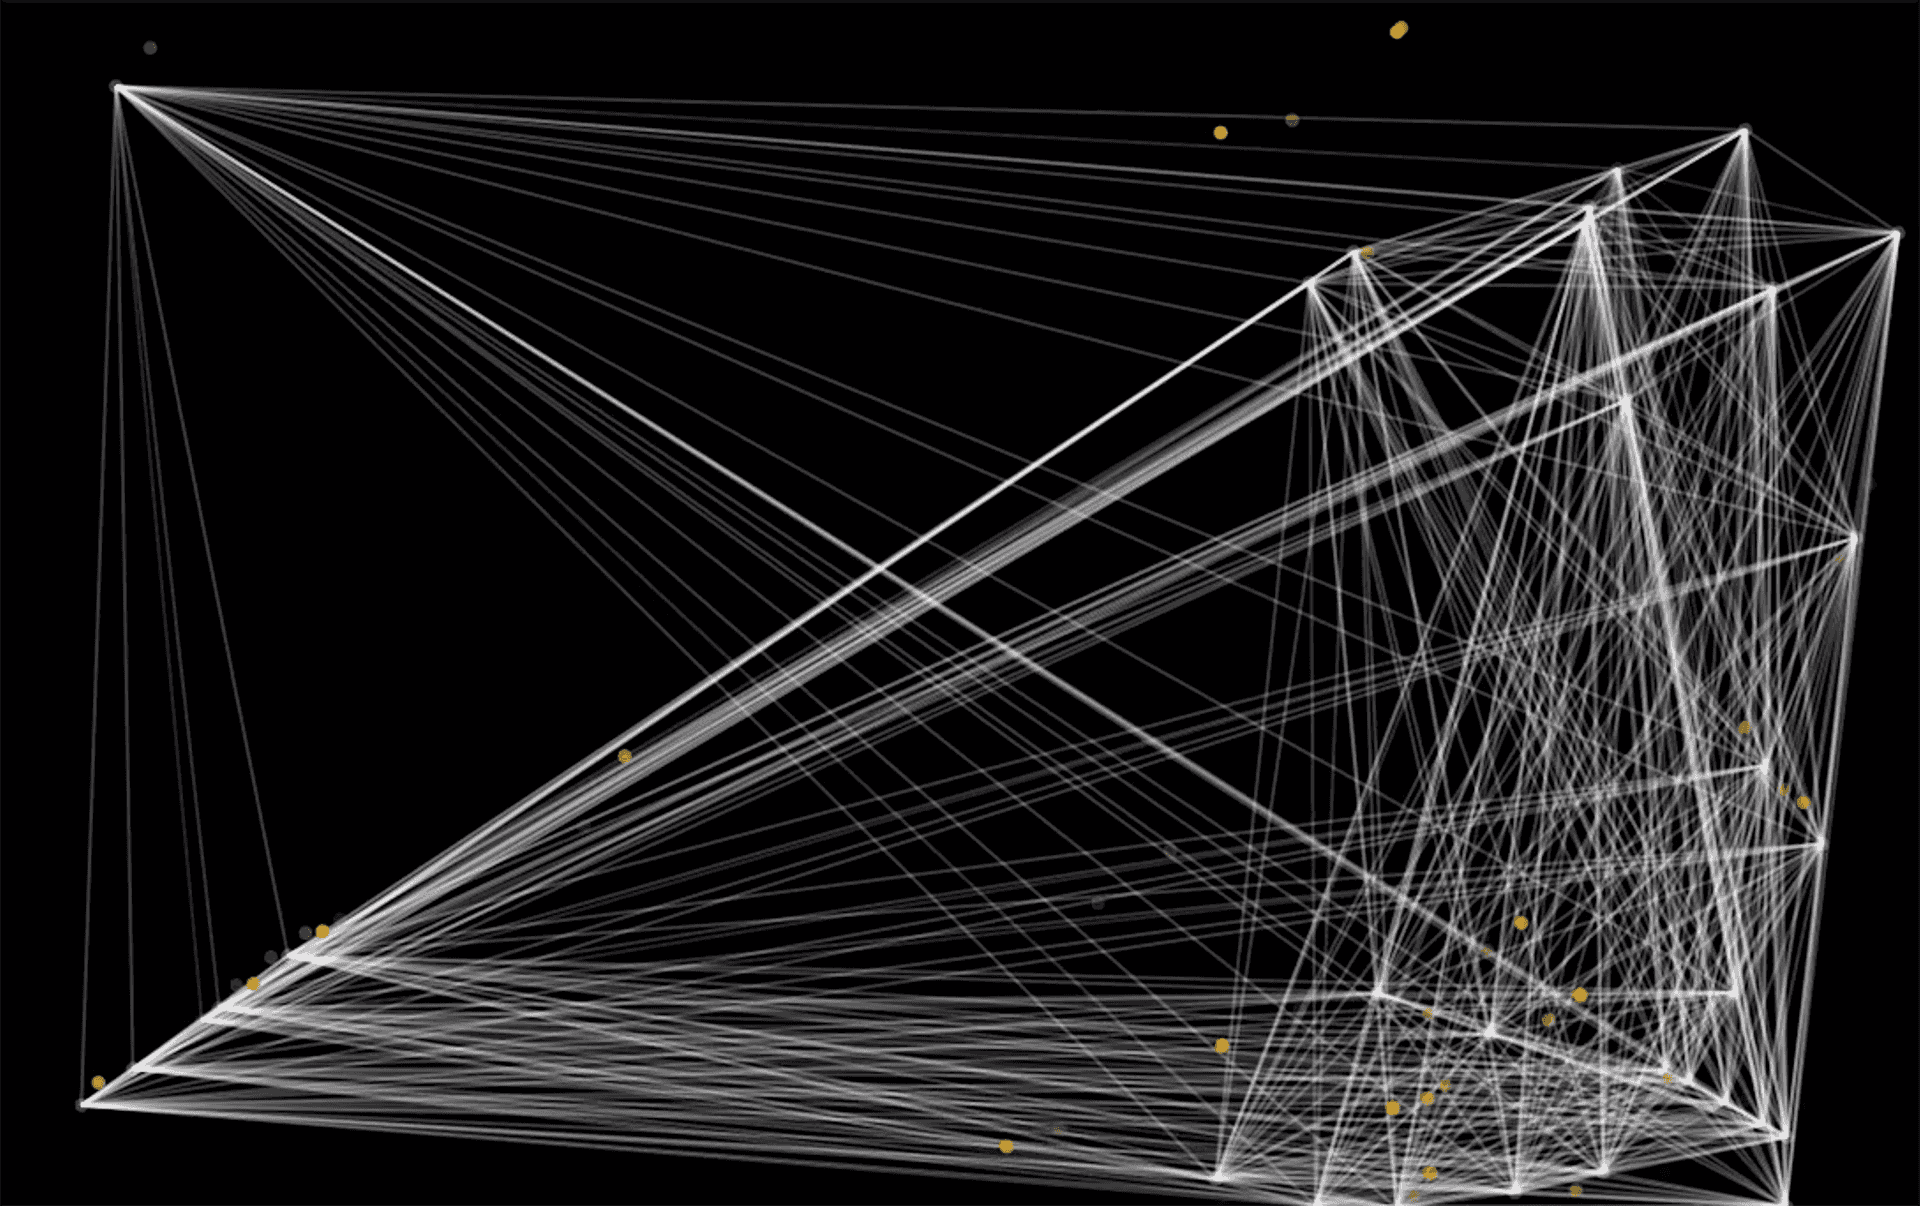
This visualizer was originally intended to present chords and tones for the Decomposing Pianos project 88 Years. An interactive piano keyboard was made using HTML5 canvas such that sounds could be played and portraits displayed. This evolved into an experimentation phase in javascript, where several…