Electromagnetic Plotter
October 18, 2016
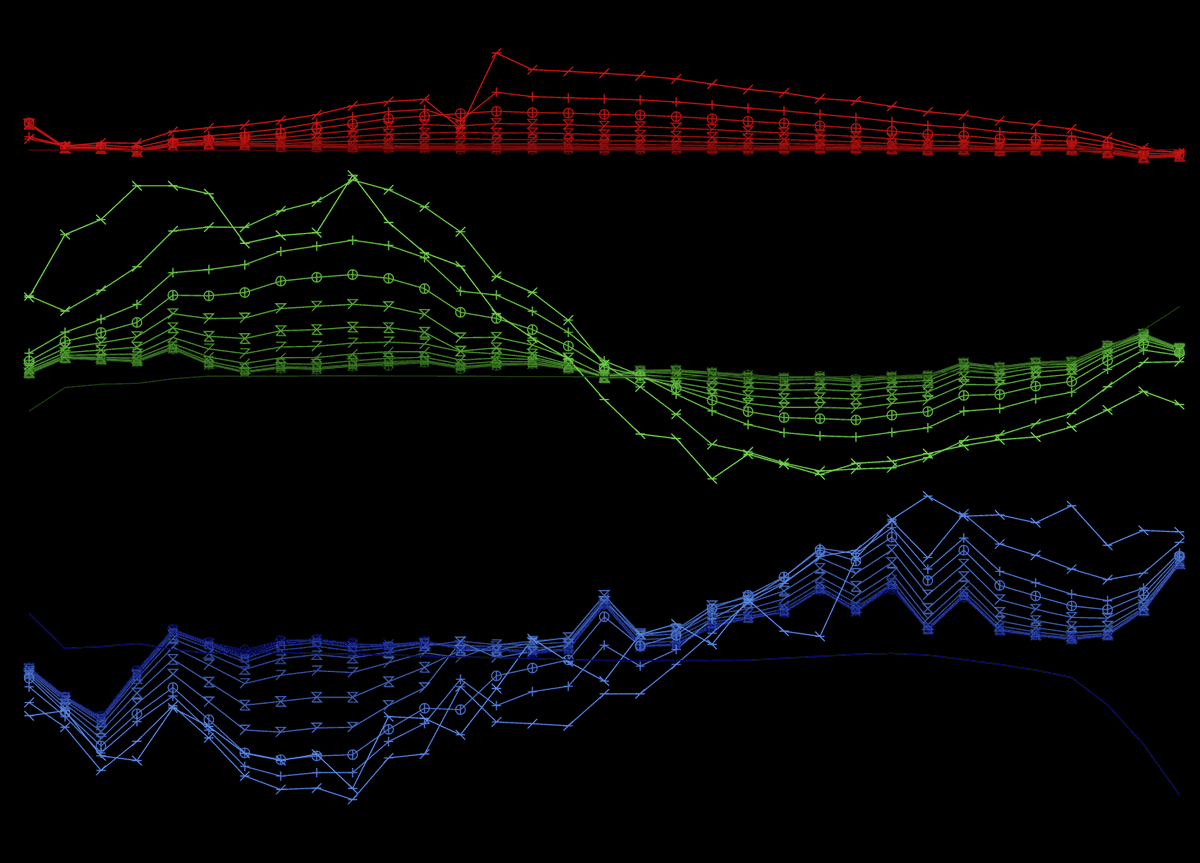
A three component plot of electromagetic UTEM data collected in the field, Hz is red, Hy is green and Hx is blue.
This is a web application that plots electromagnetic (EM) responses from imported files. Referred to simply as "plotter", it is now used as a consulting tool and by clients to plot time domain UTEM data in a web browser.
Plotter needed to be capable of plotting downhole and surface data, and orient EM data to display different components from the raw data collected in the field or borehole.
These components are:
(u v w) - raw components as measured
(s n w) - oriented components in line with a borehole and rotated according to an S-azimuth
(l t z) - raw components in line with a surface coil
(X Y Z) - cartesian components
(L T z) - geographical components rotated according to an L-azimuth
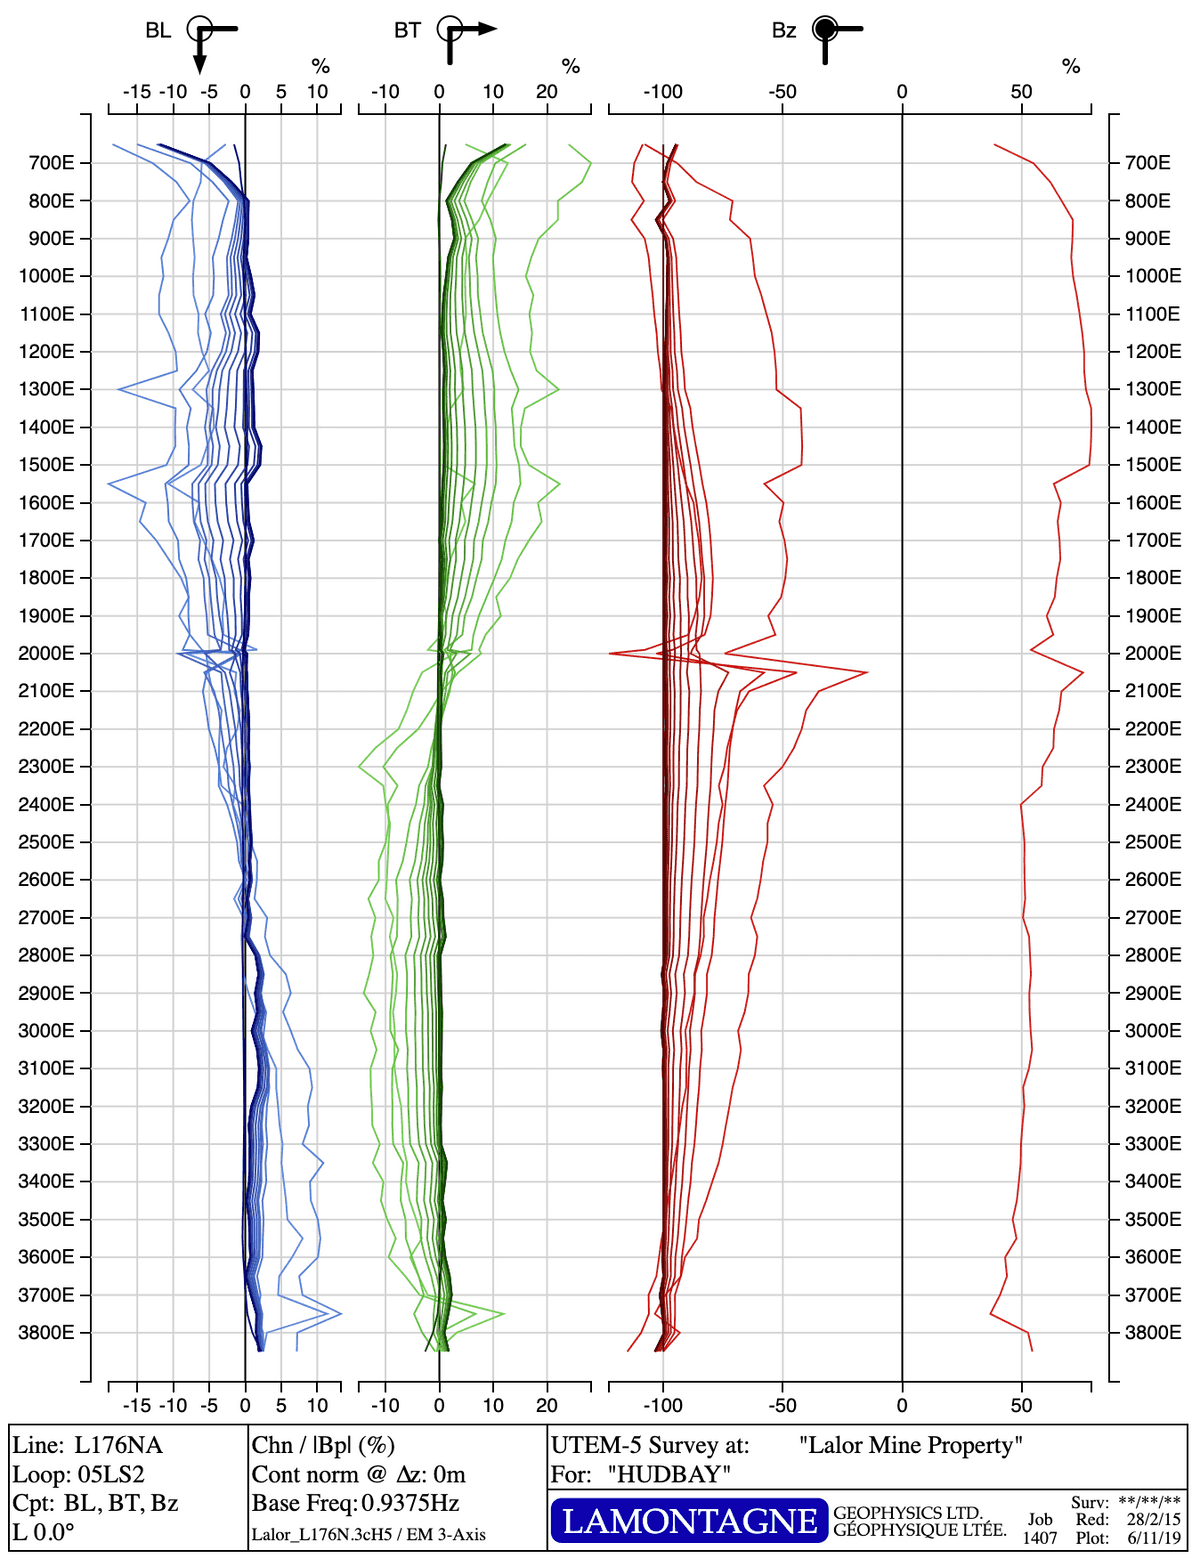
Orientation is collected from magnetic and/or accelerometer readings and is read in with the data, the weighting of each adjusted with a trade off ratio. The azimuths can be adjusted live in plotter in addition to the trade off ratio. The data can be normalized to a primary field as percent or plotted in raw nano- or picoTesla. Multiple plots can be positioned on the same axis and added or subtracted from each other. The plots are suitable for printing or exporting to pdf using the print function in the browser.
A variety of export formats are available including .TEM (Maxwell), .c3c (Geosoft), .tsv (tab seperated), .3cH5 (Lamontagne) as well as several JSON export options to save sessions, store diplay settings, or export to Multiloop for further analysis.
Sample data plotted from a publically released surface data set. To view this follow the application link and select Load Sample Data under the ABOUT tab.