Web applications are websites that can be interacted with through your browser. As such, you can follow the application link at the top of each post to visit the project.
Taped Together, June 25, 2021
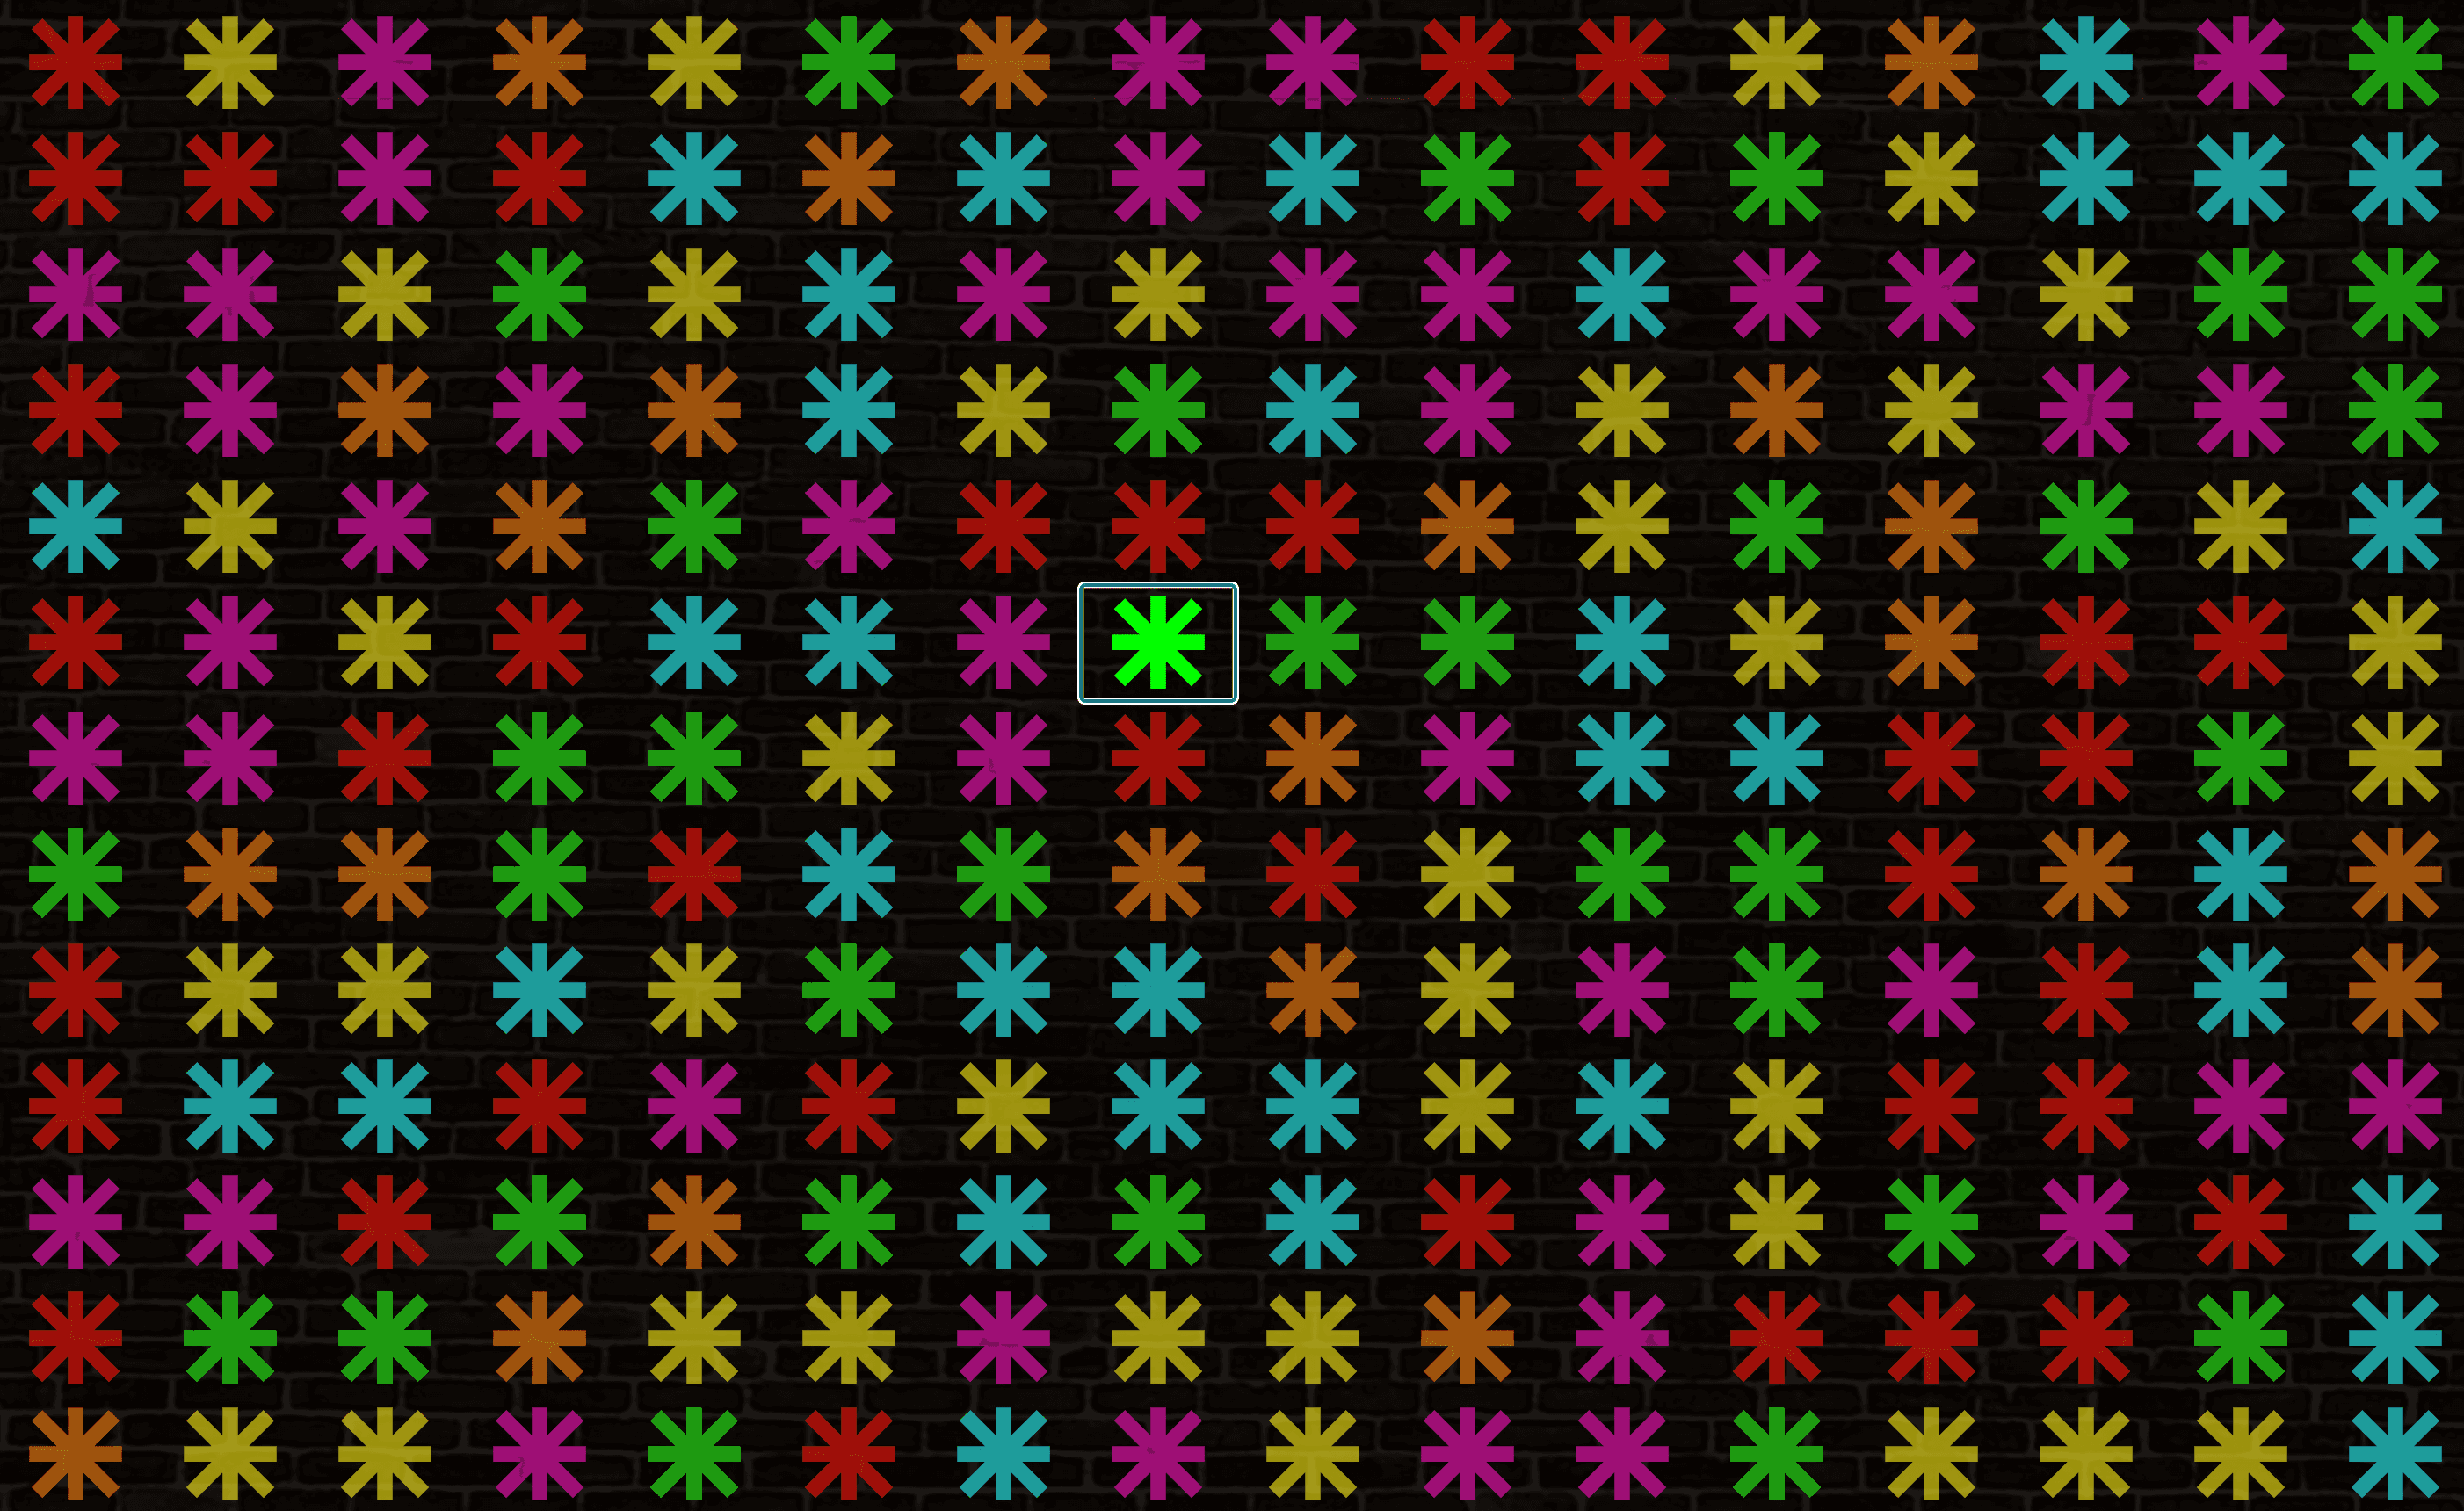
Taped Together was a collection of publicly submitted responses to the prompt "I am getting vaccinated because...". It is inspired by the work of artist Mark Reinhart’s duct tape graffiti on city buildings, who during the COVID-19 pandemic connected the community with bright coloured messages of…
POLLEN - Slack App, April 08, 2021
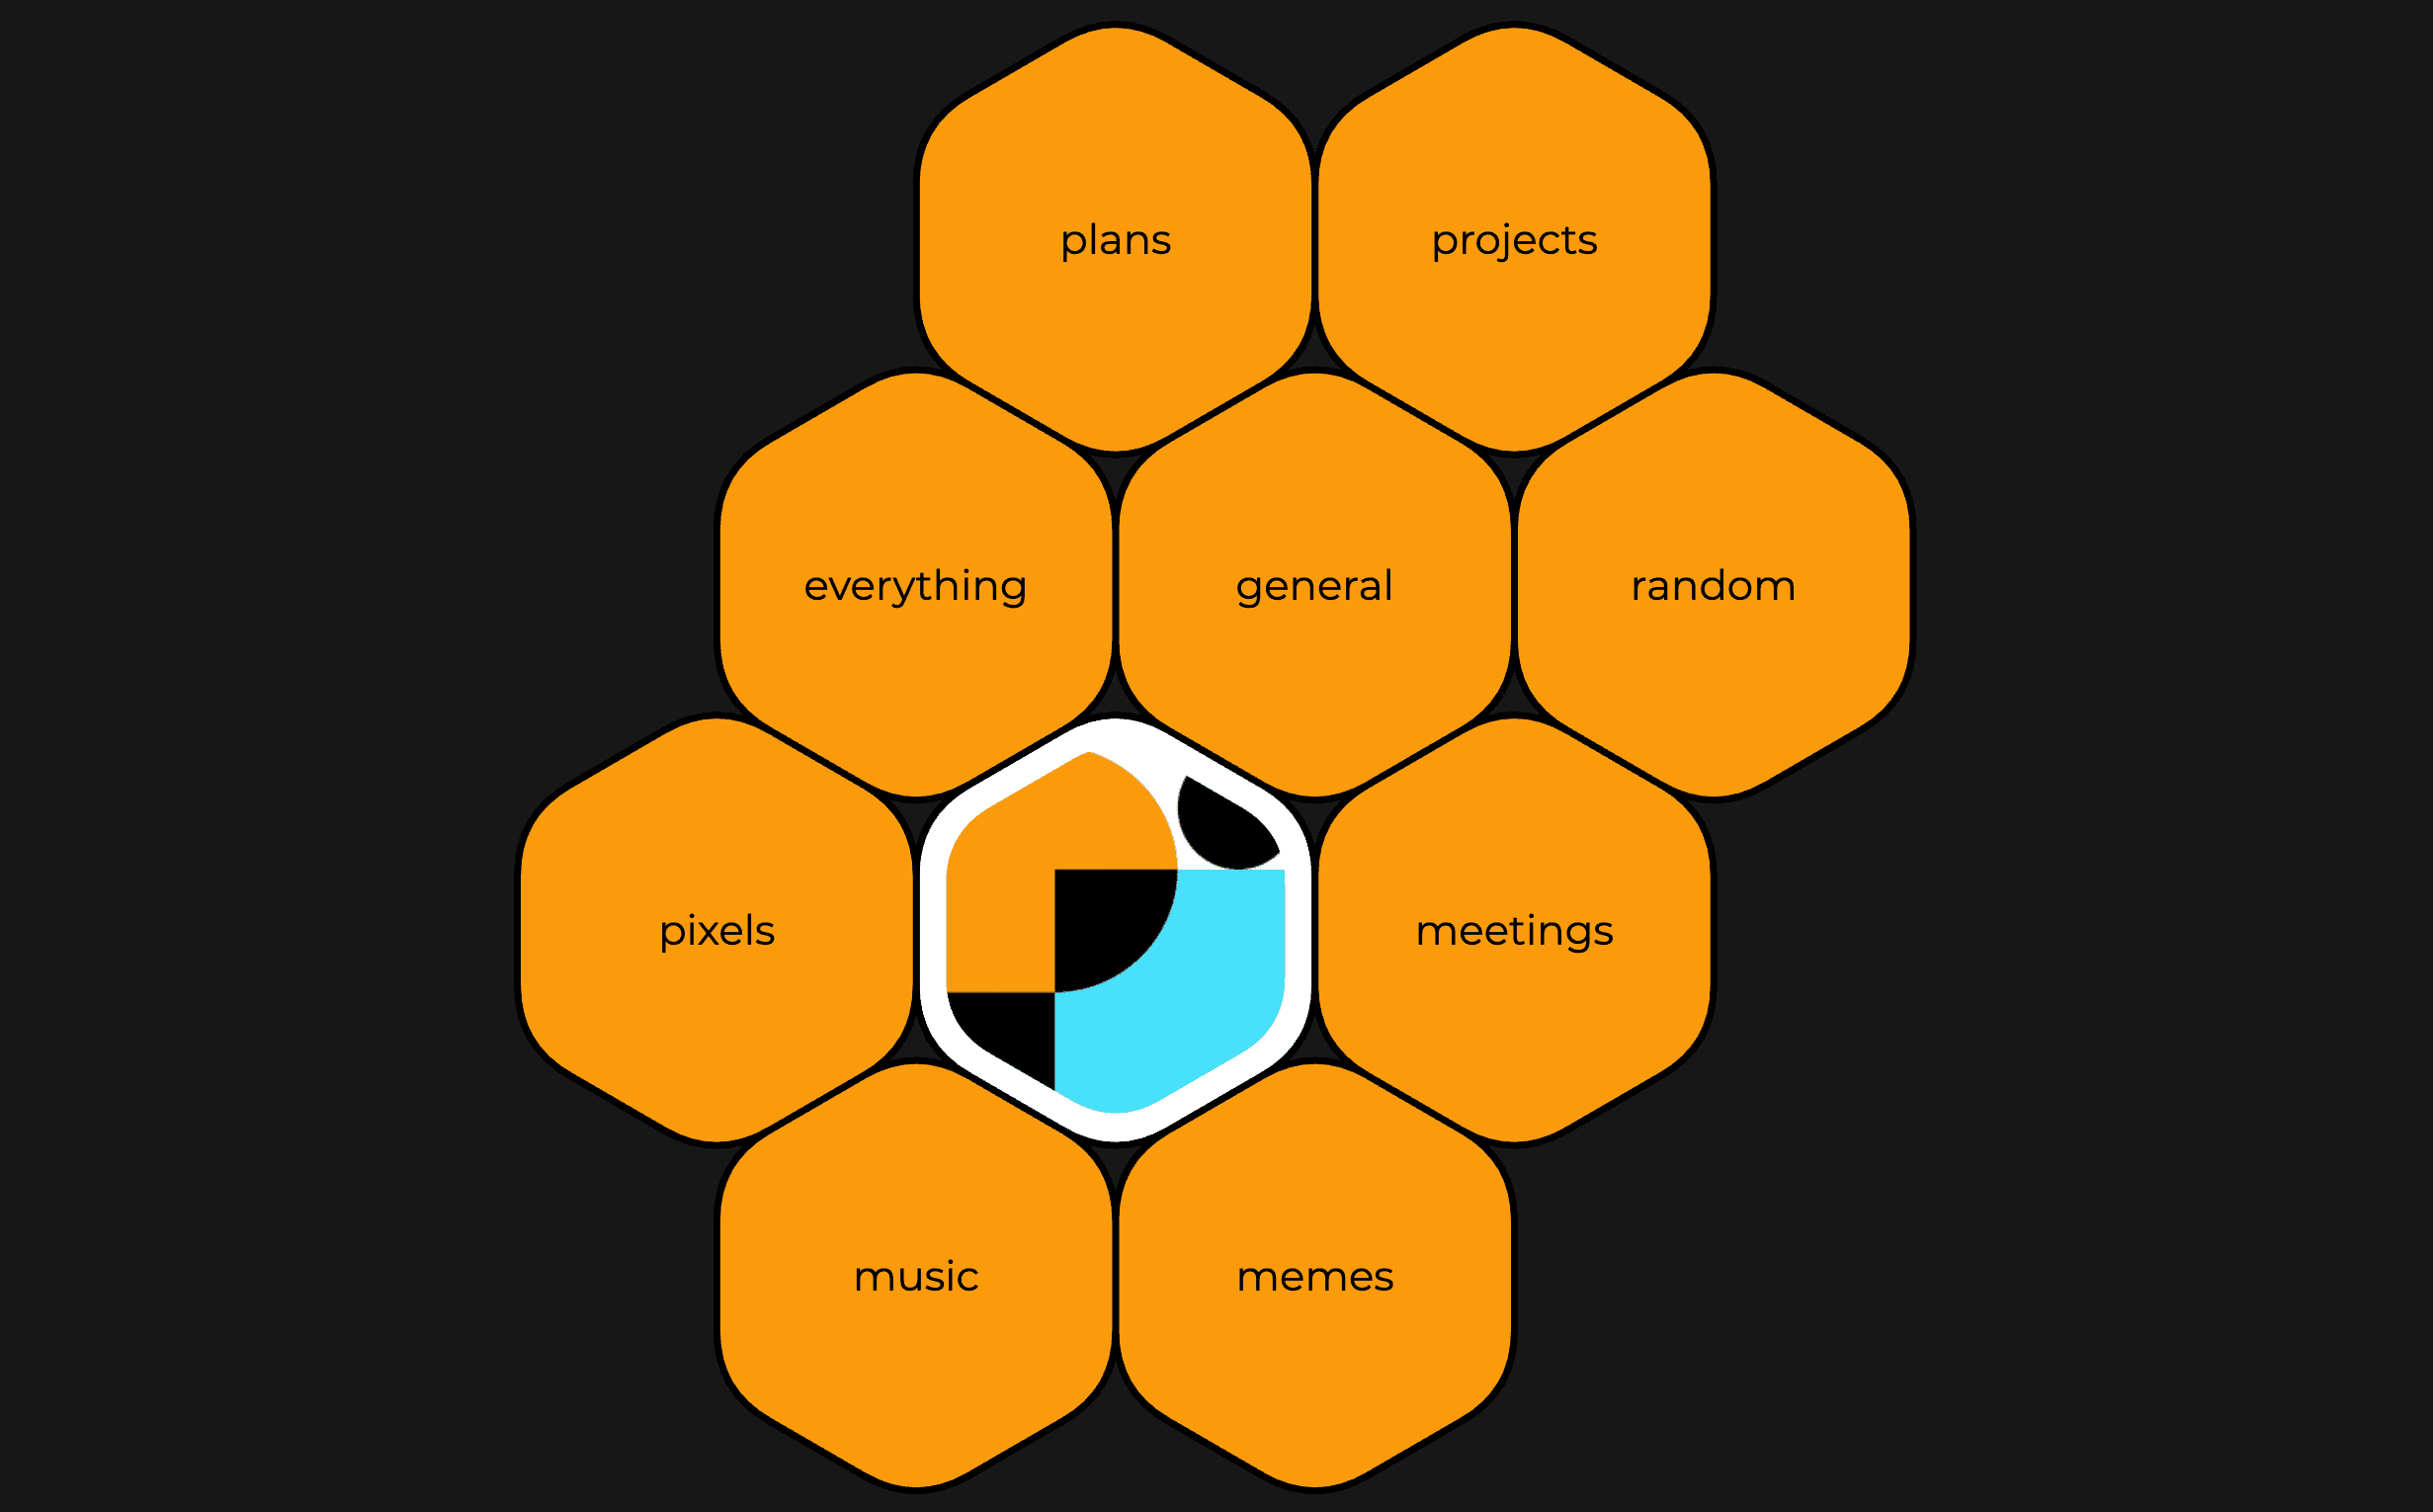
POLLEN started as an idea to visualize Slack workspace channels for the Data Visualization Society. The society has over 70 channels and it was difficult for members to get a sense of the channel landscape and the amazing discussions. Working to solve this problem quickly evolved into creating a new…
Between the Sand - Phase 3 - Online Exhibition, December 05, 2020
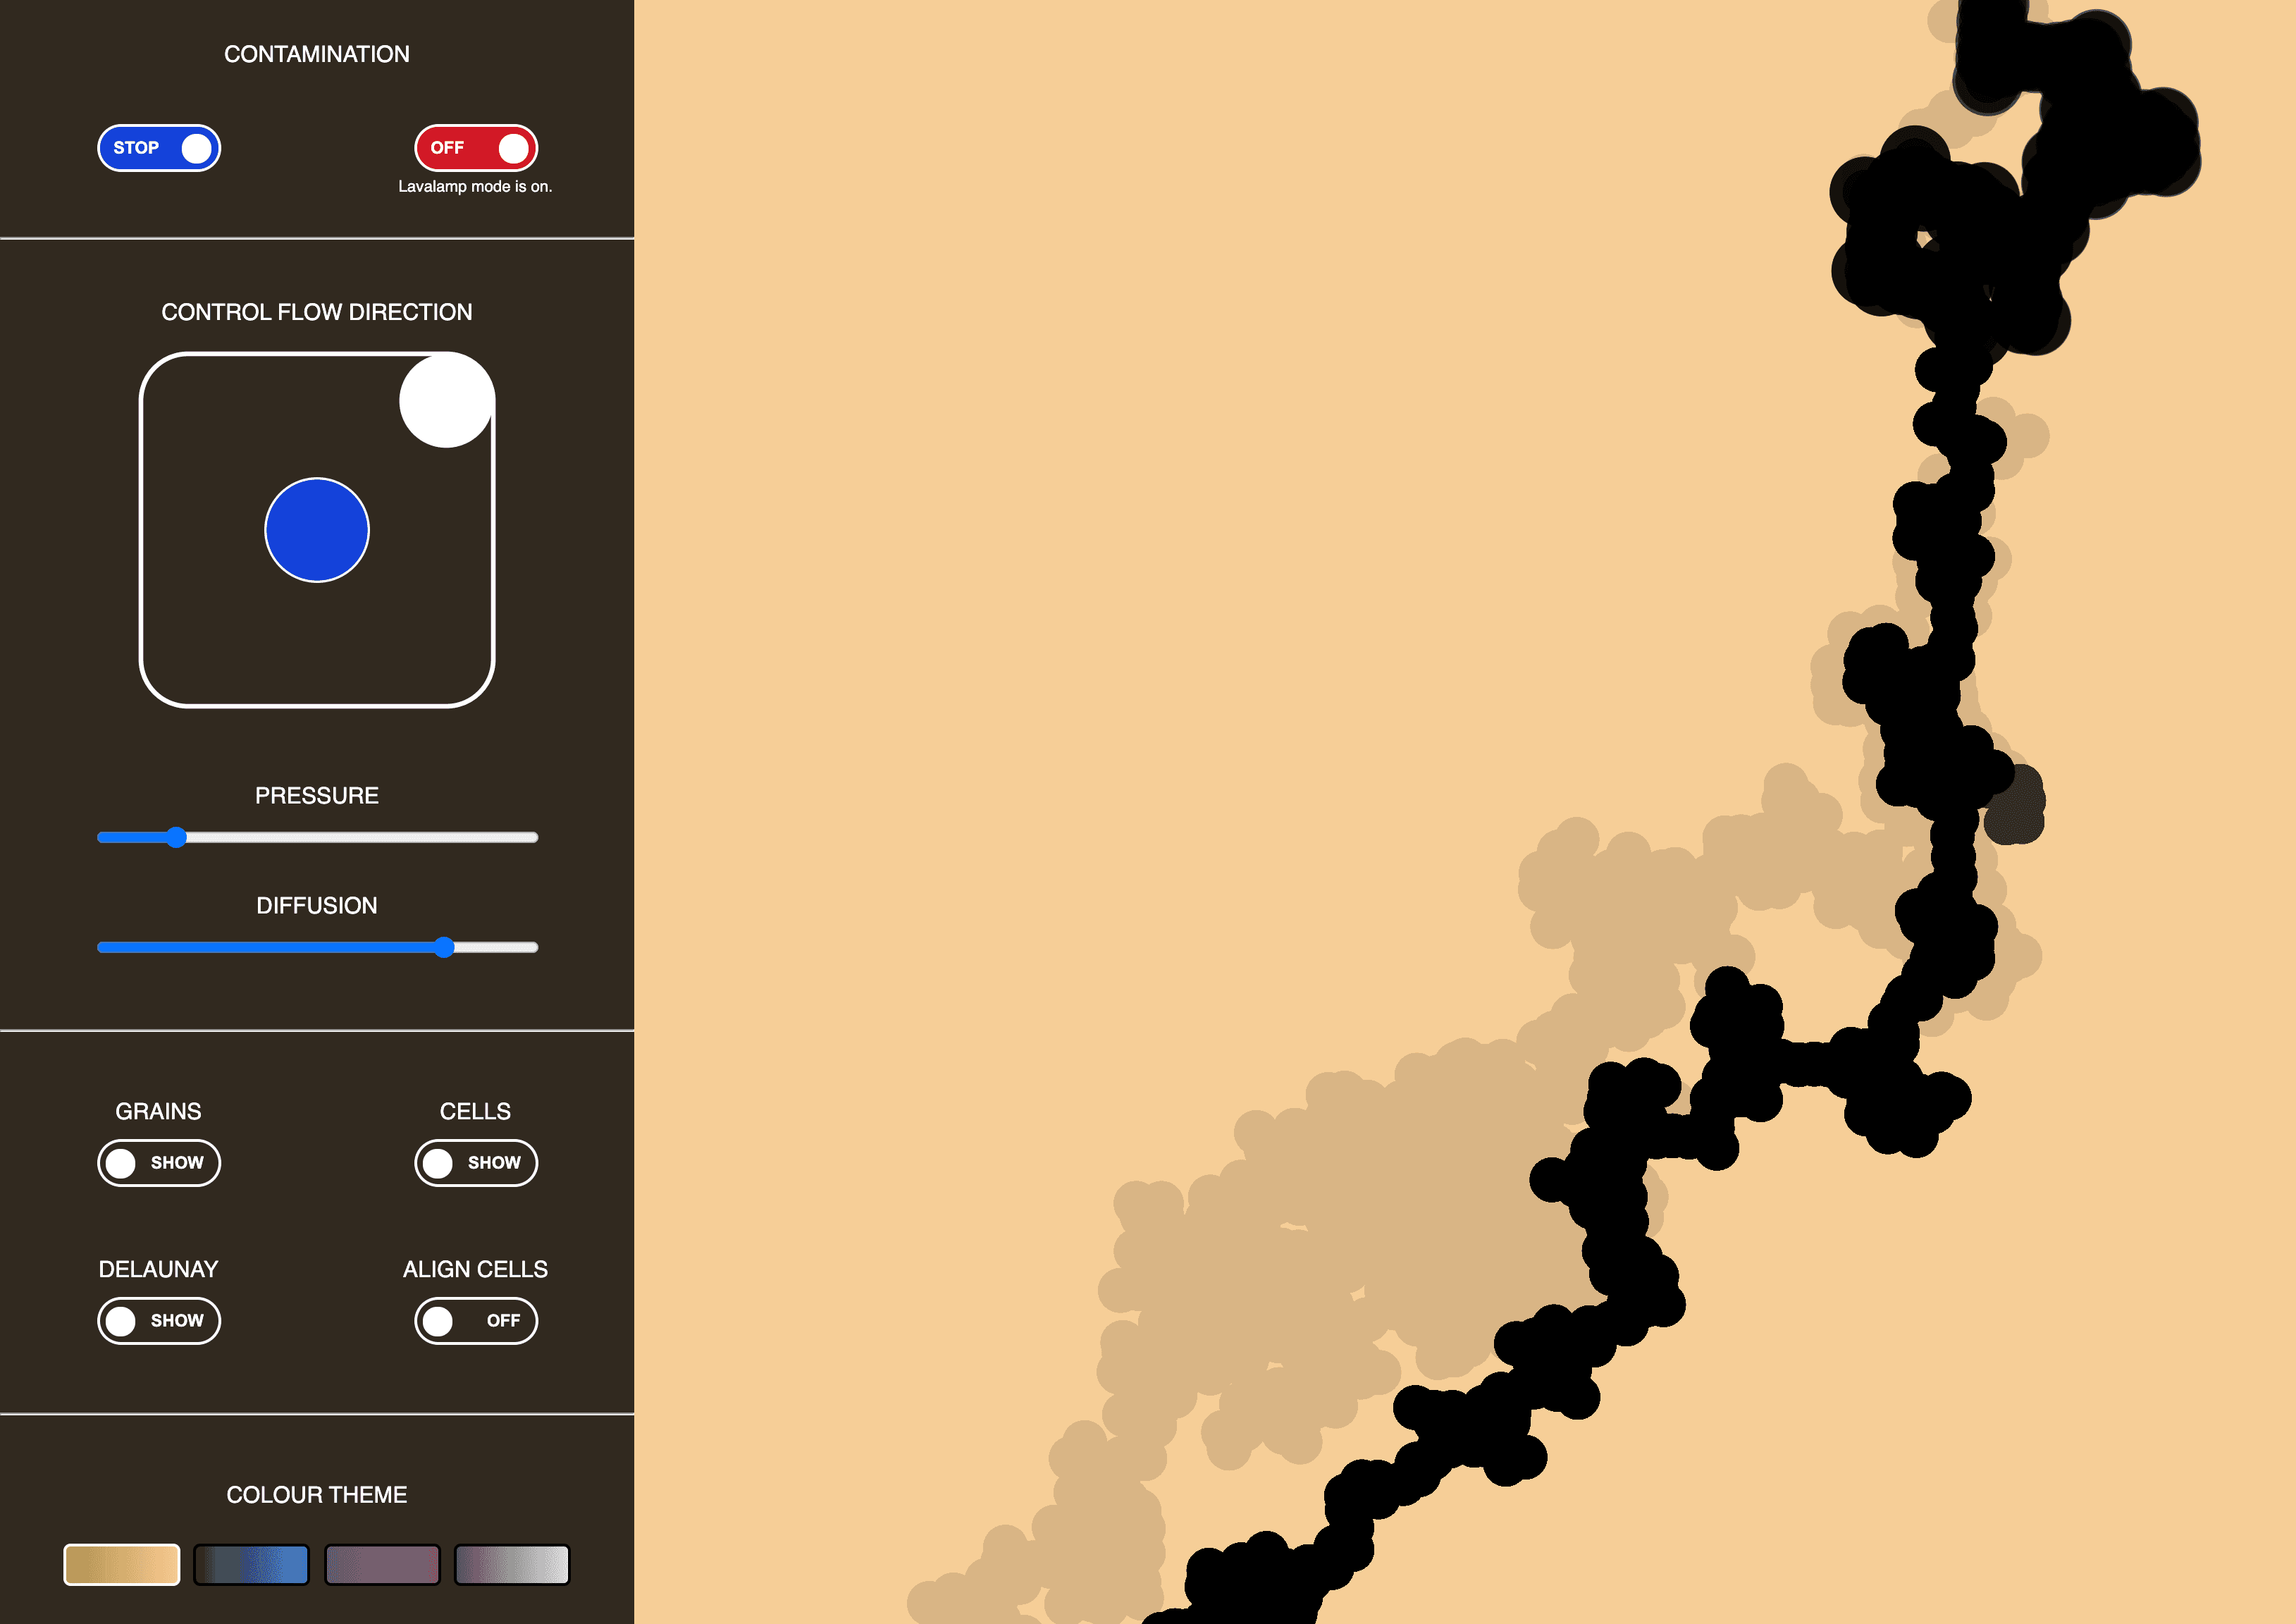
The third and final phase of Between the Sand is an interactive web application that premiered in Art the Science's Polyfield Gallery on December 5th, 2020 to coincide with World Soil Day. To create this, the web application from Phase 2 was expanded and optimized. An Explore tab was added where one…
CSUCH - Data Visualizer, March 22, 2019
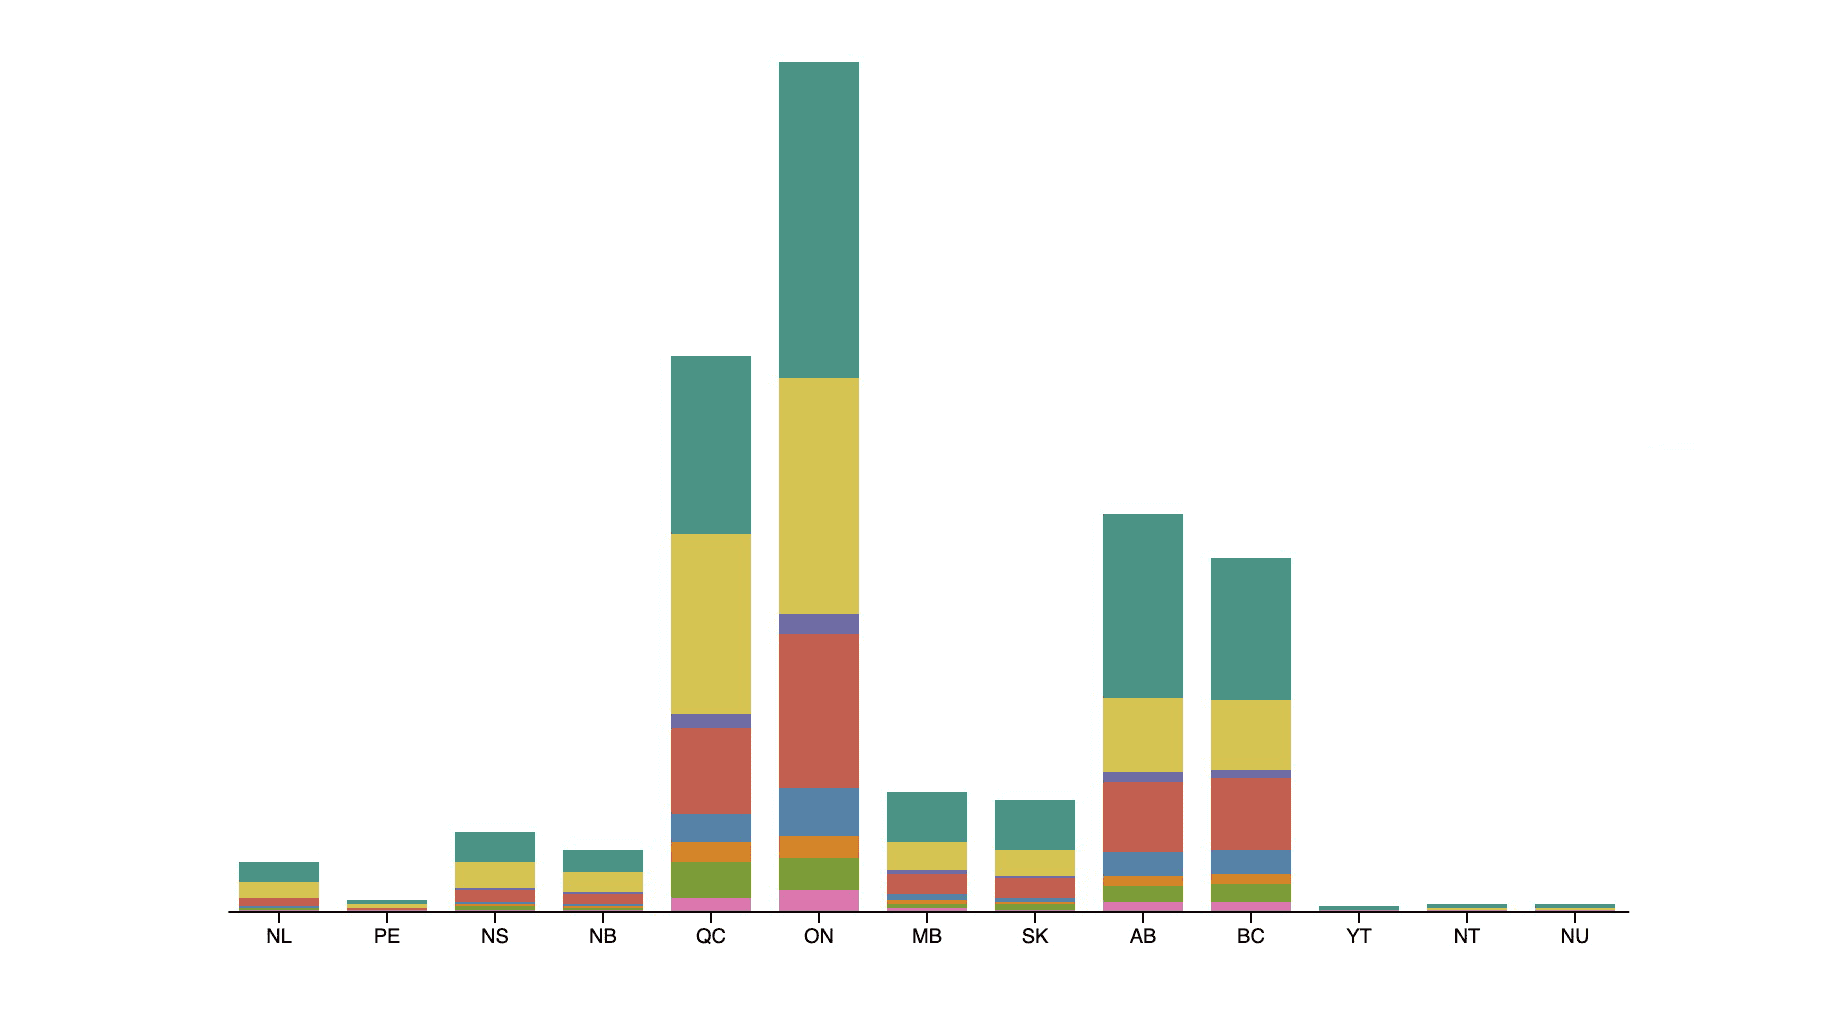
This data visualization tool displays the costs and harms of substance use in Canada, and offers options to filter and compare the data to better explore and understand trends and changes in how Canada spends its resources on substance use and addiction. This data is provided by Canadian Substance…
Between the Sand - Phase 2 - Local Event, February 27, 2019
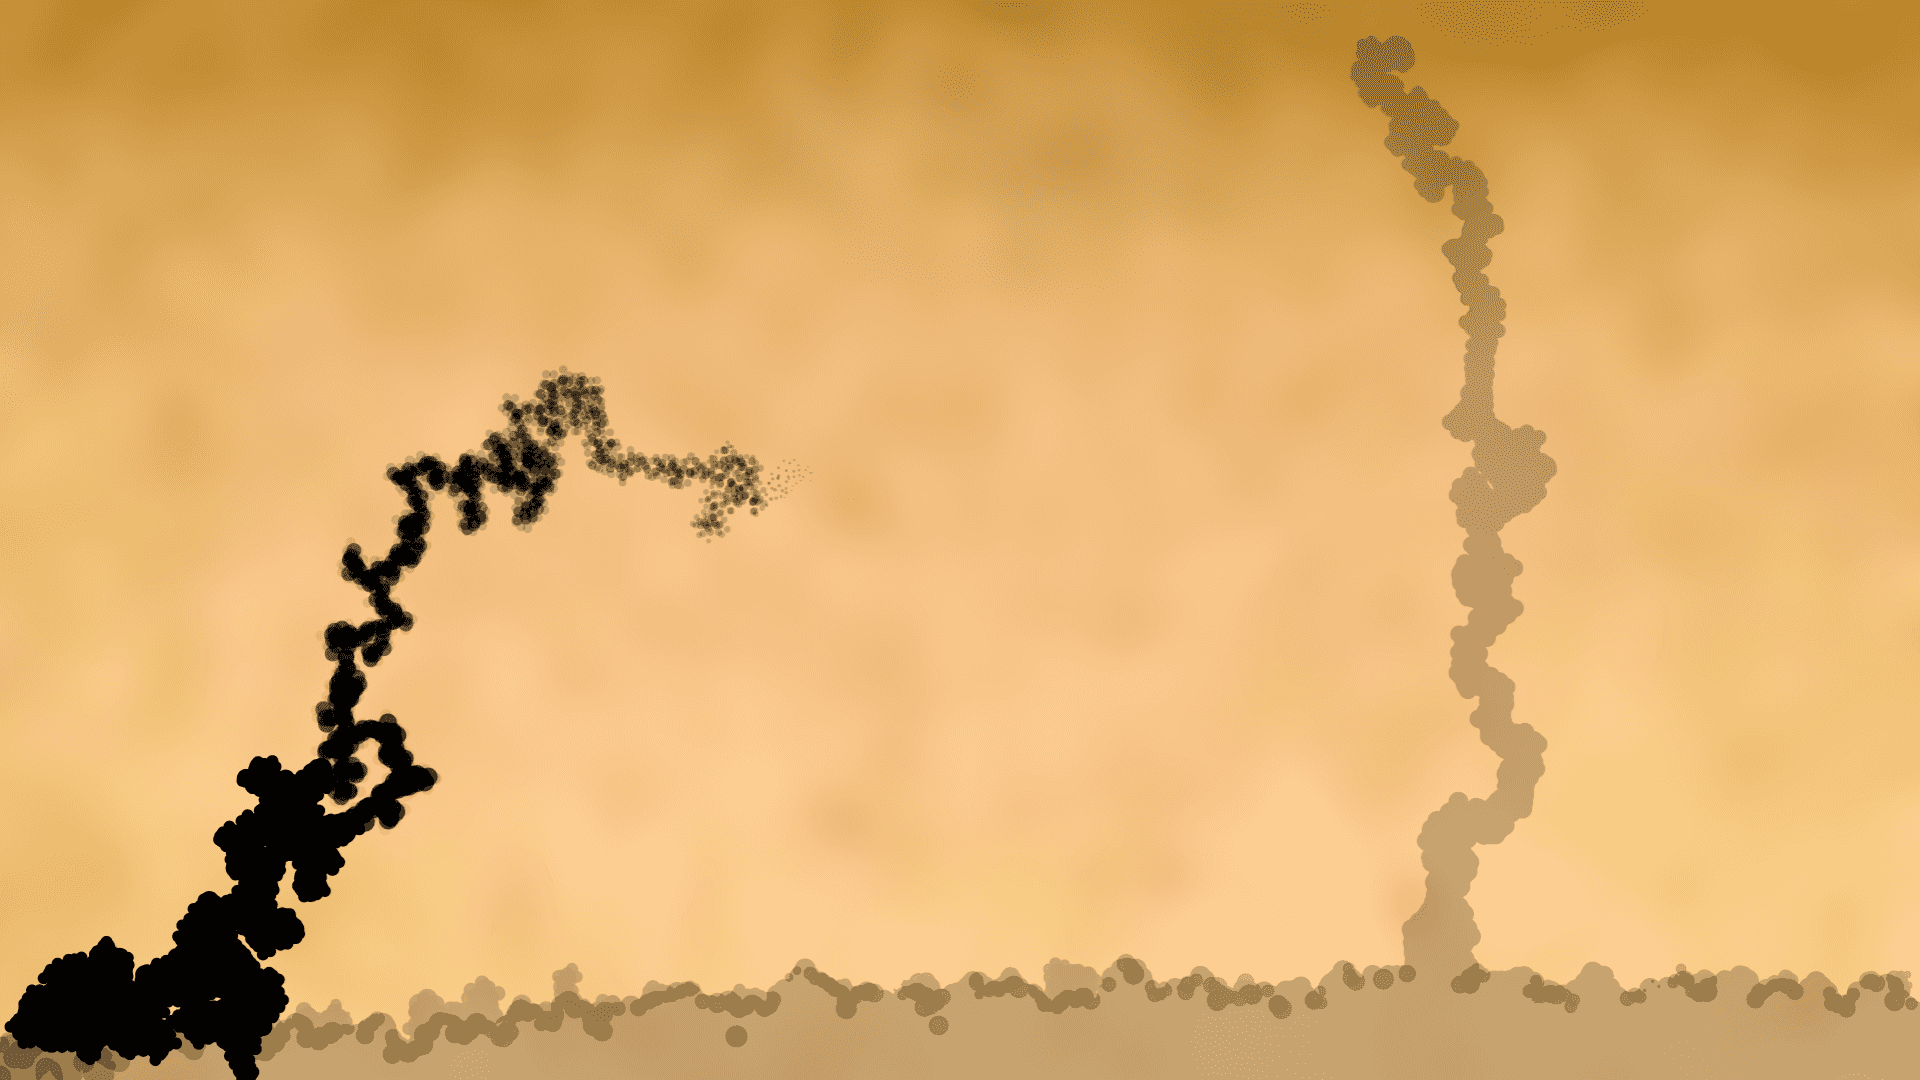
Phase 2 of the Between the Sand residency was a public installation at the Modern Fuel ARC. The work was showcased for the first time alongside the sand coloumn used in the lab. This was a chance for the local community to meet the research group, the residency organizers and the artist to disuss…
Multiloop, 3D Visualizer, October 18, 2018
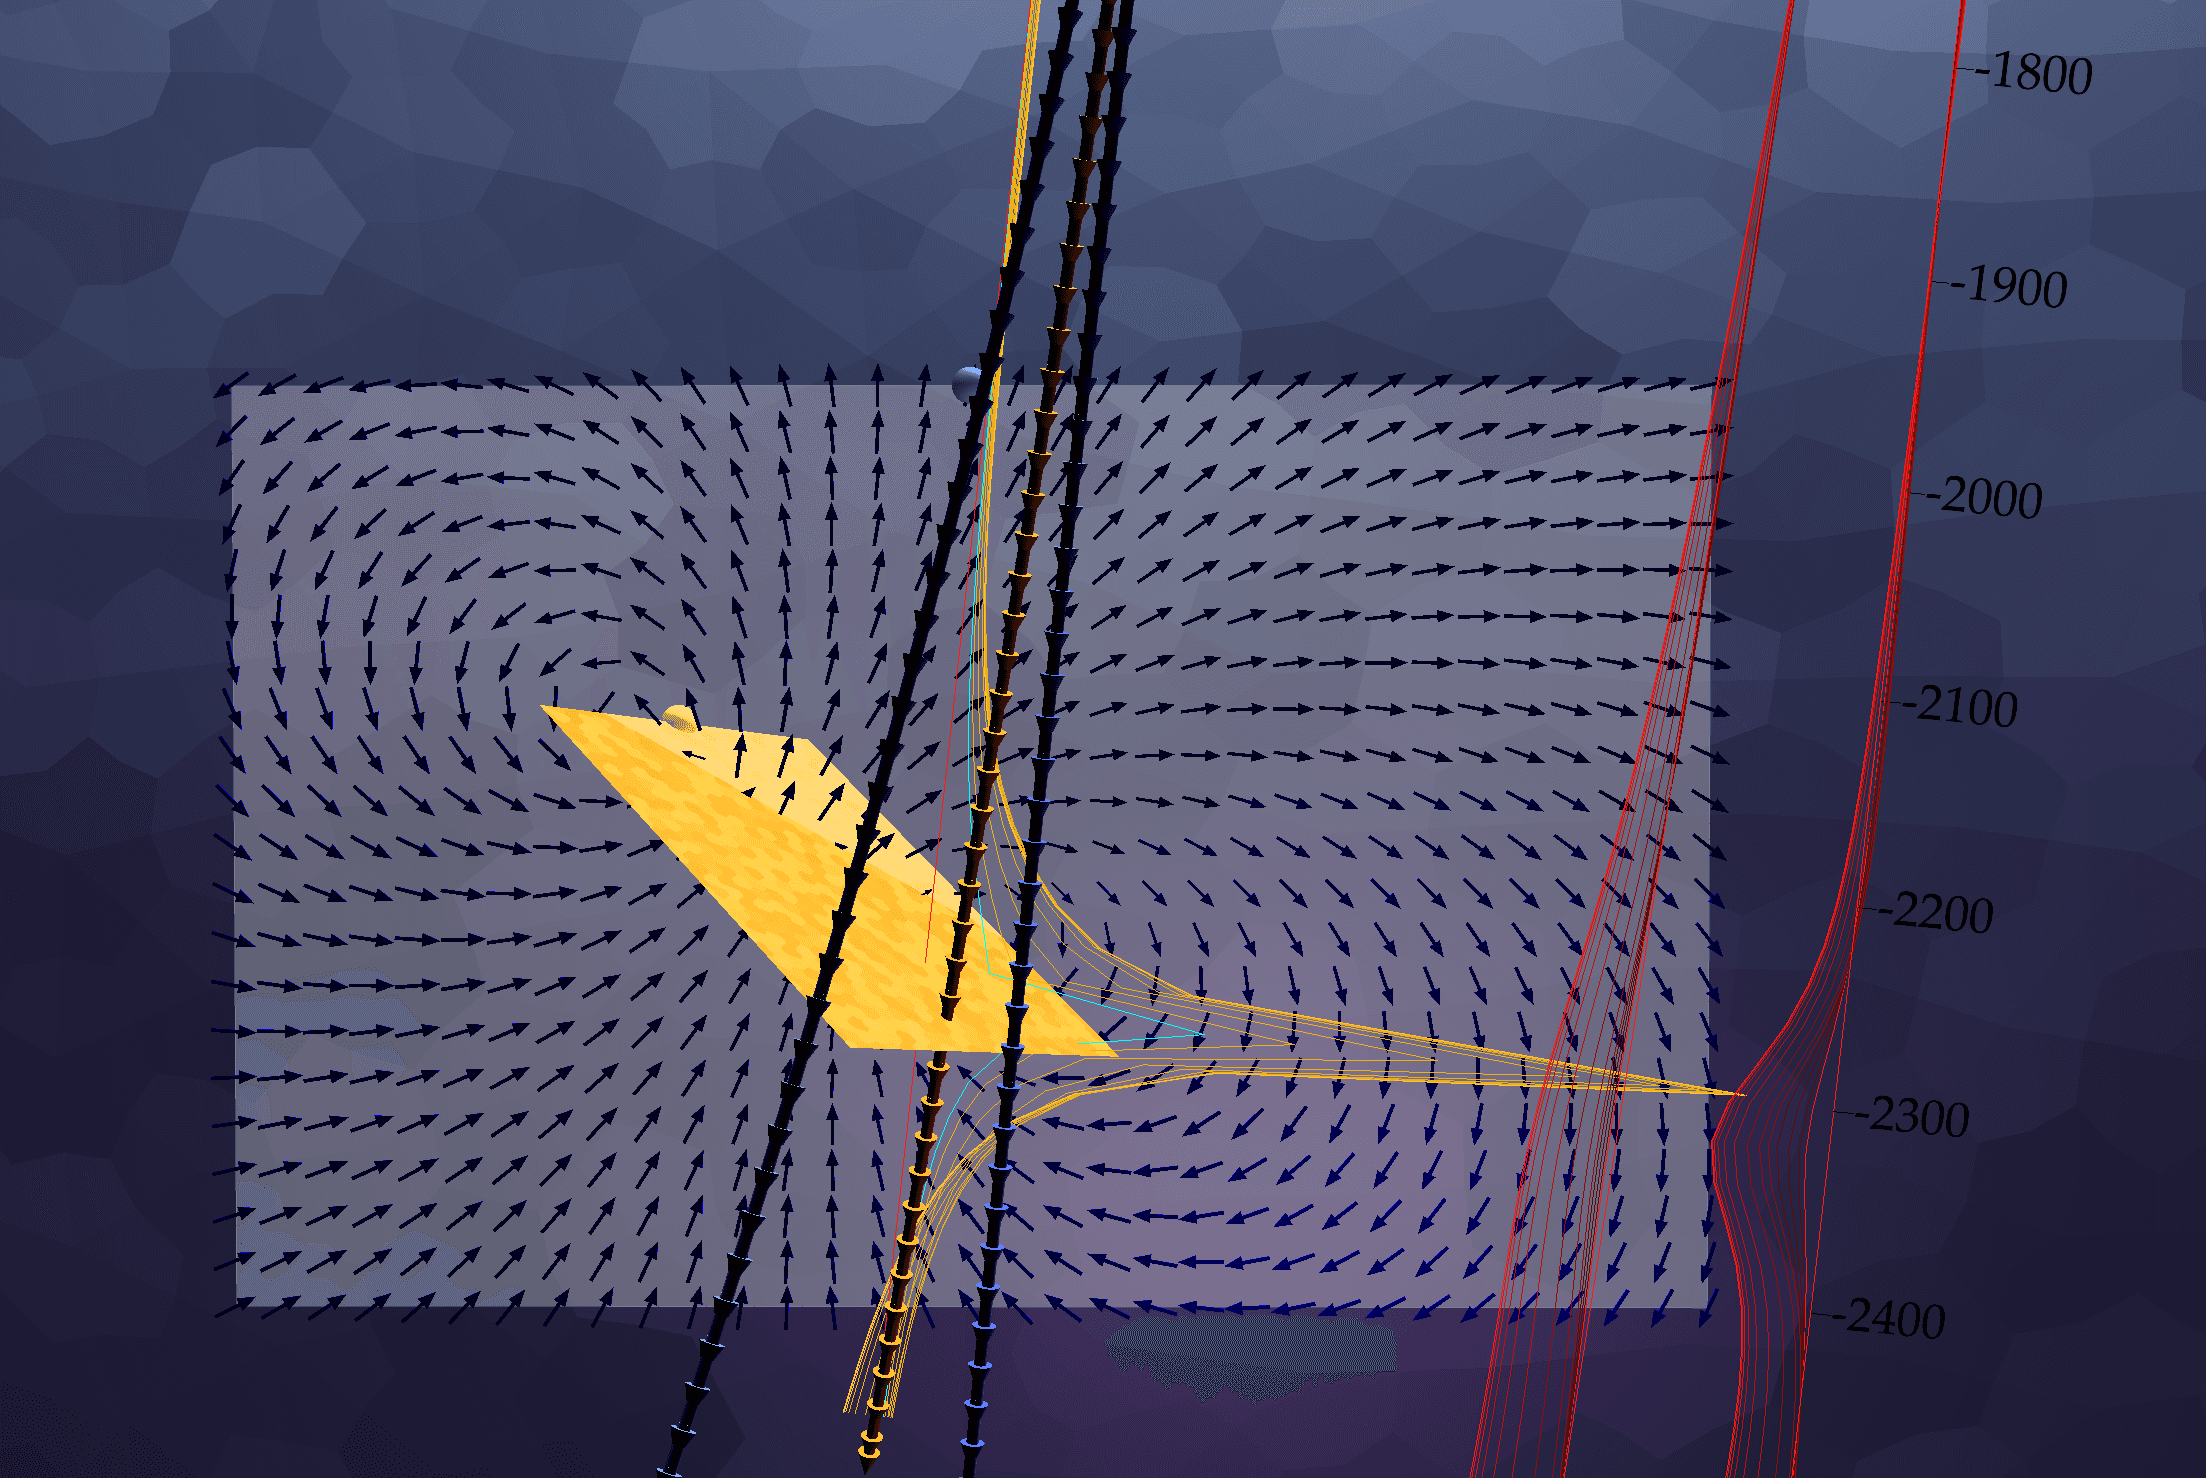
Multiloop is forward modelling software that helps geophysicists visualize electromagnetic responses from conductive meshes. This software is mainly used as a consulting tool that models data collected in the field and compares this to synthetic responses. By carefully noting the differences…
Between the Sand - Phase 1 - In the Lab, March 30, 2018
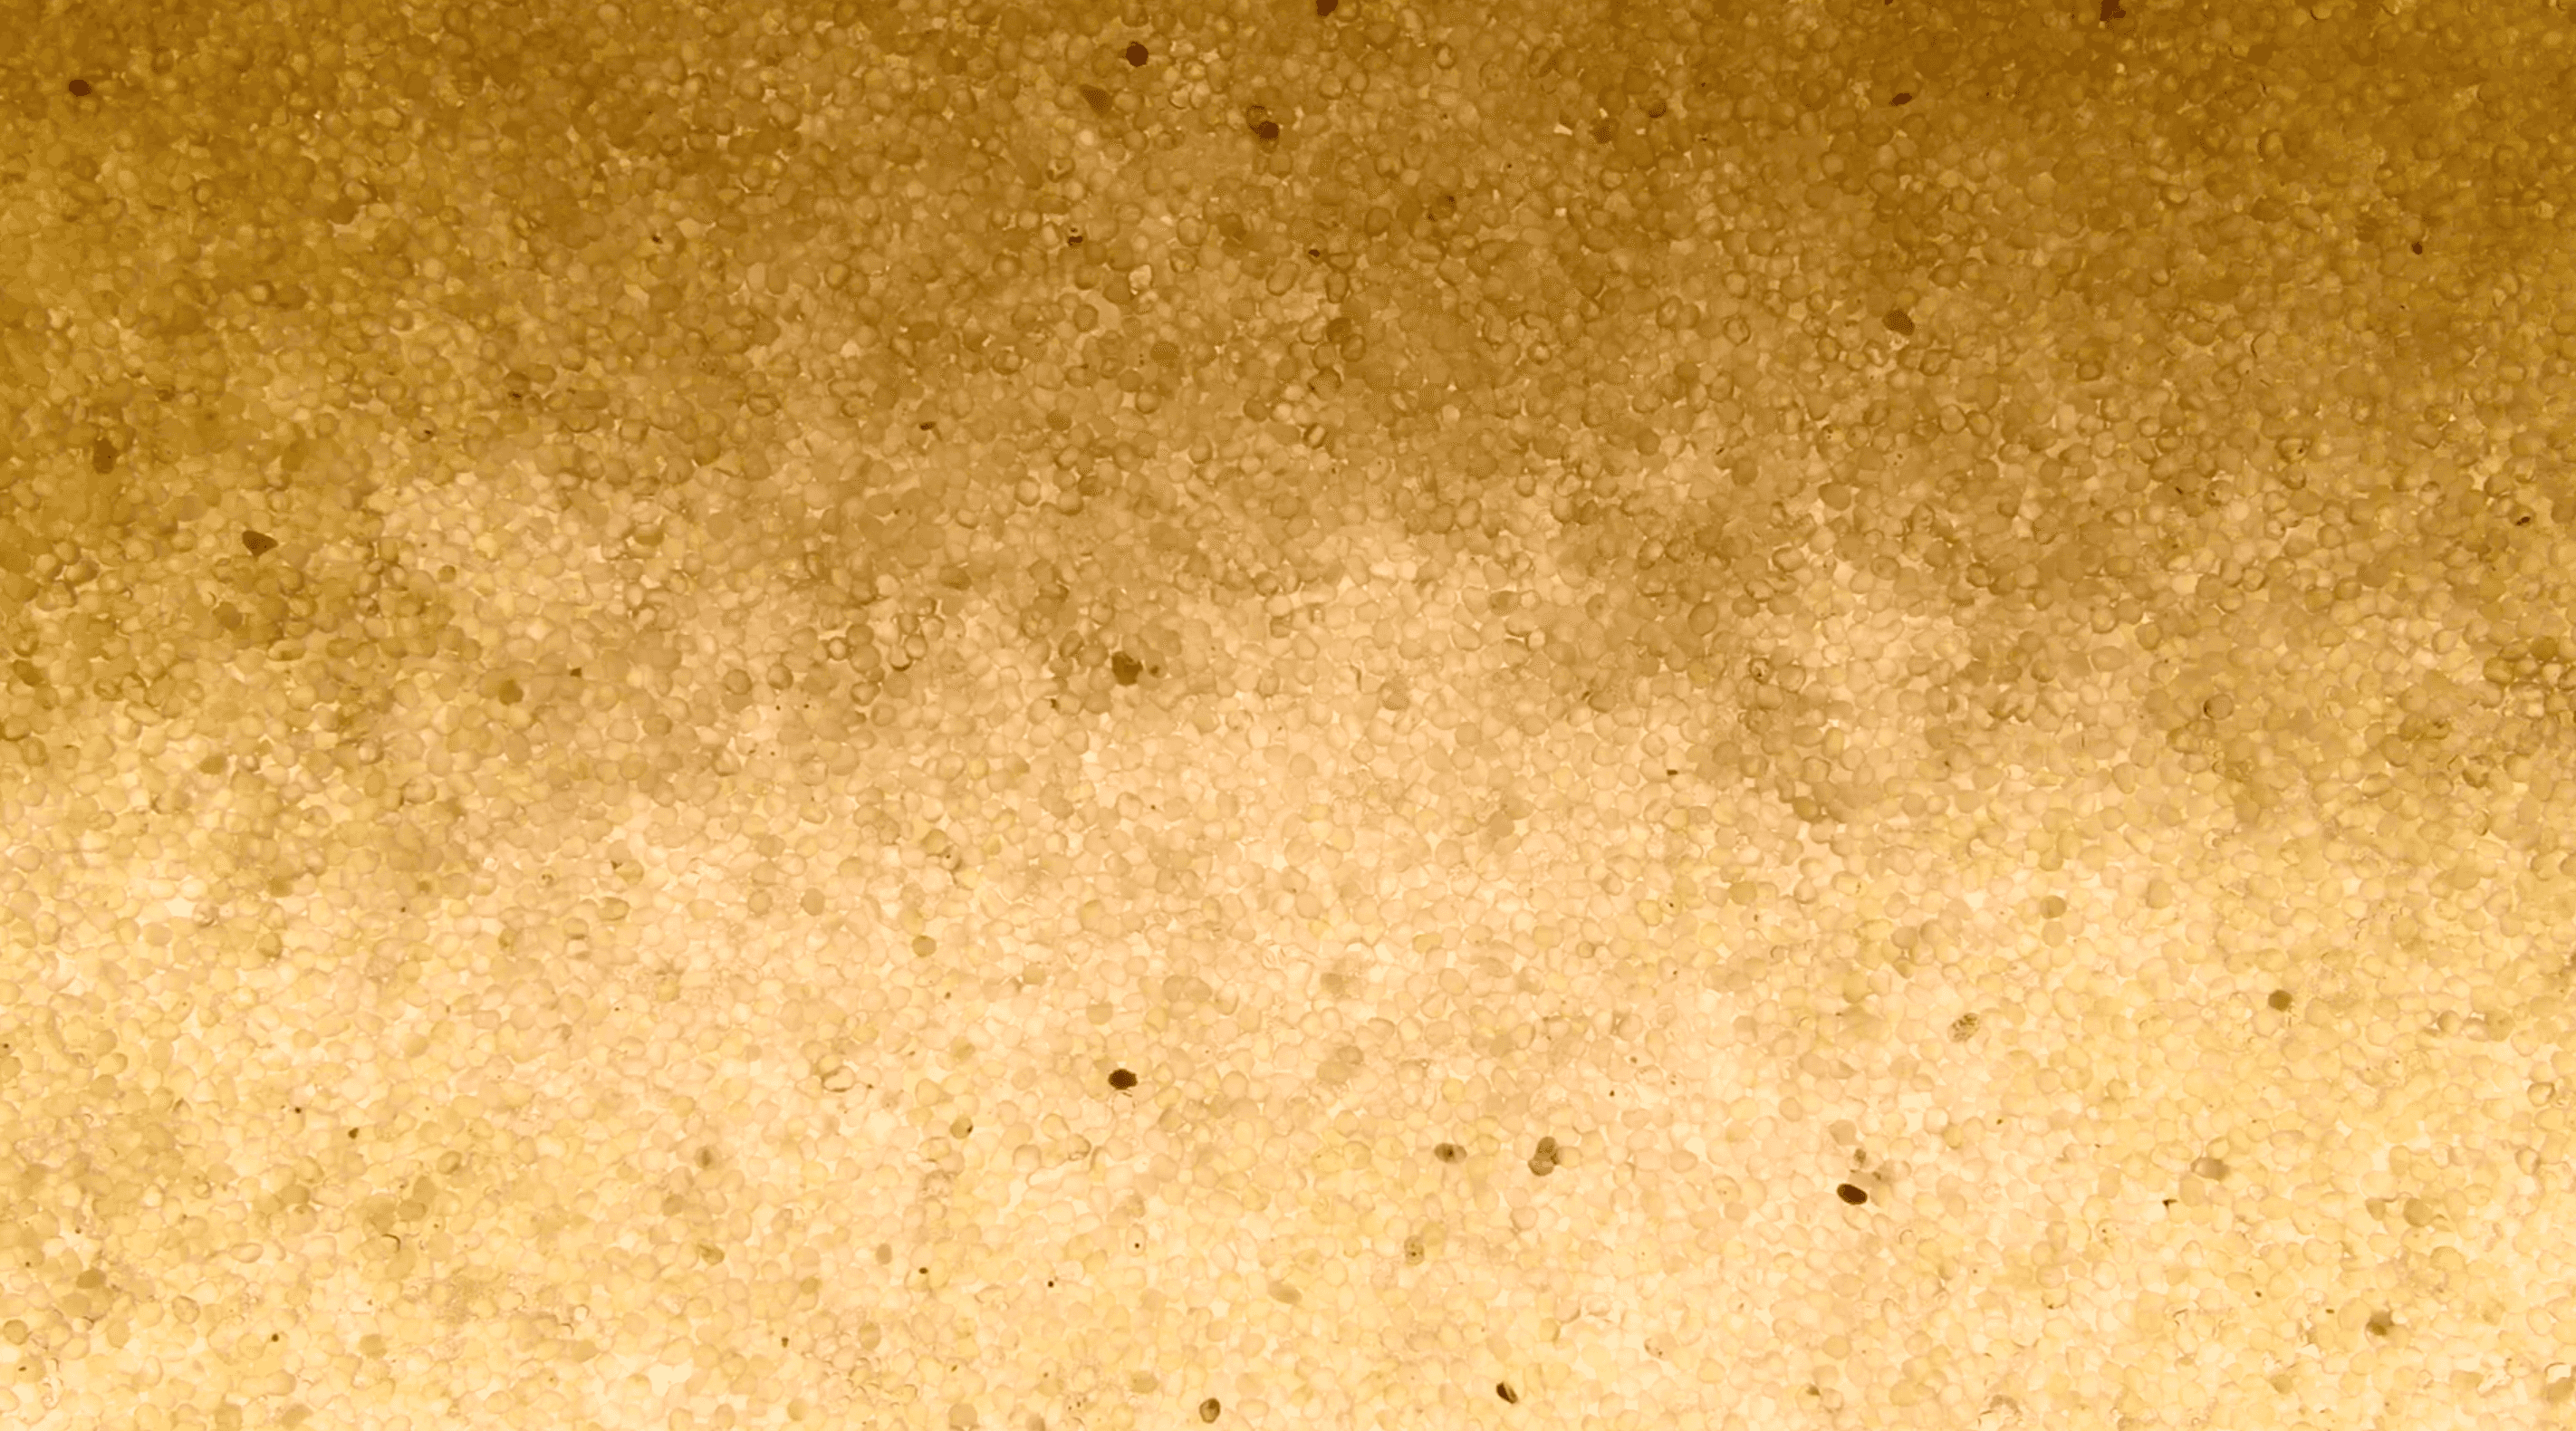
Between the Sand started as artist residency in Dr. Kevin Mumford's Research Lab at the Department of Civil Engineering at Queen's University in Kingston, Ontario, Canada. It was organized, facilitated and hosted in collaboration with Art the Science. This was an immersive residency lasting two…
Community Flow, March 13, 2018
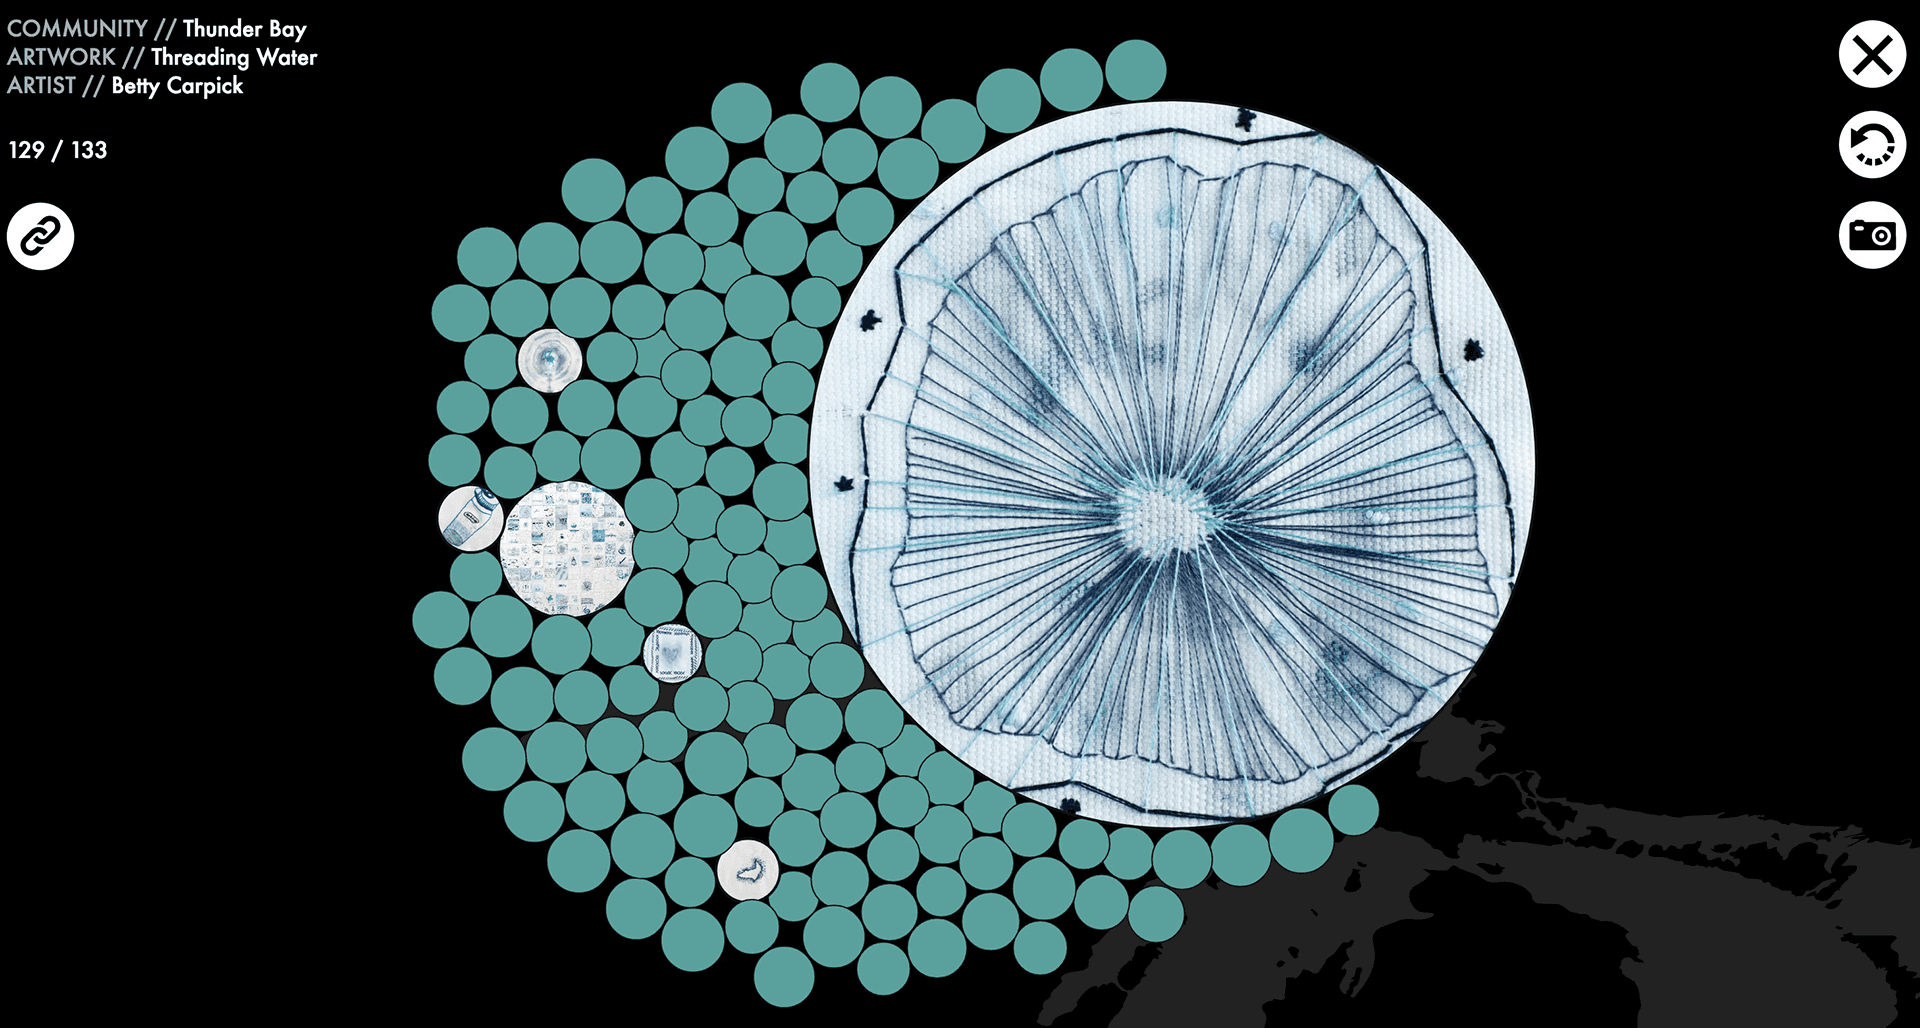
Community Flow was created to bring together artworks from eight communities on the Canadian side of the Great Lakes. Each community had an artist work alongside volunteers to create one artwork from many smaller contributions. This project was to feature each of the final artworks, as well as the…
Electromagnetic Plotter, October 18, 2016
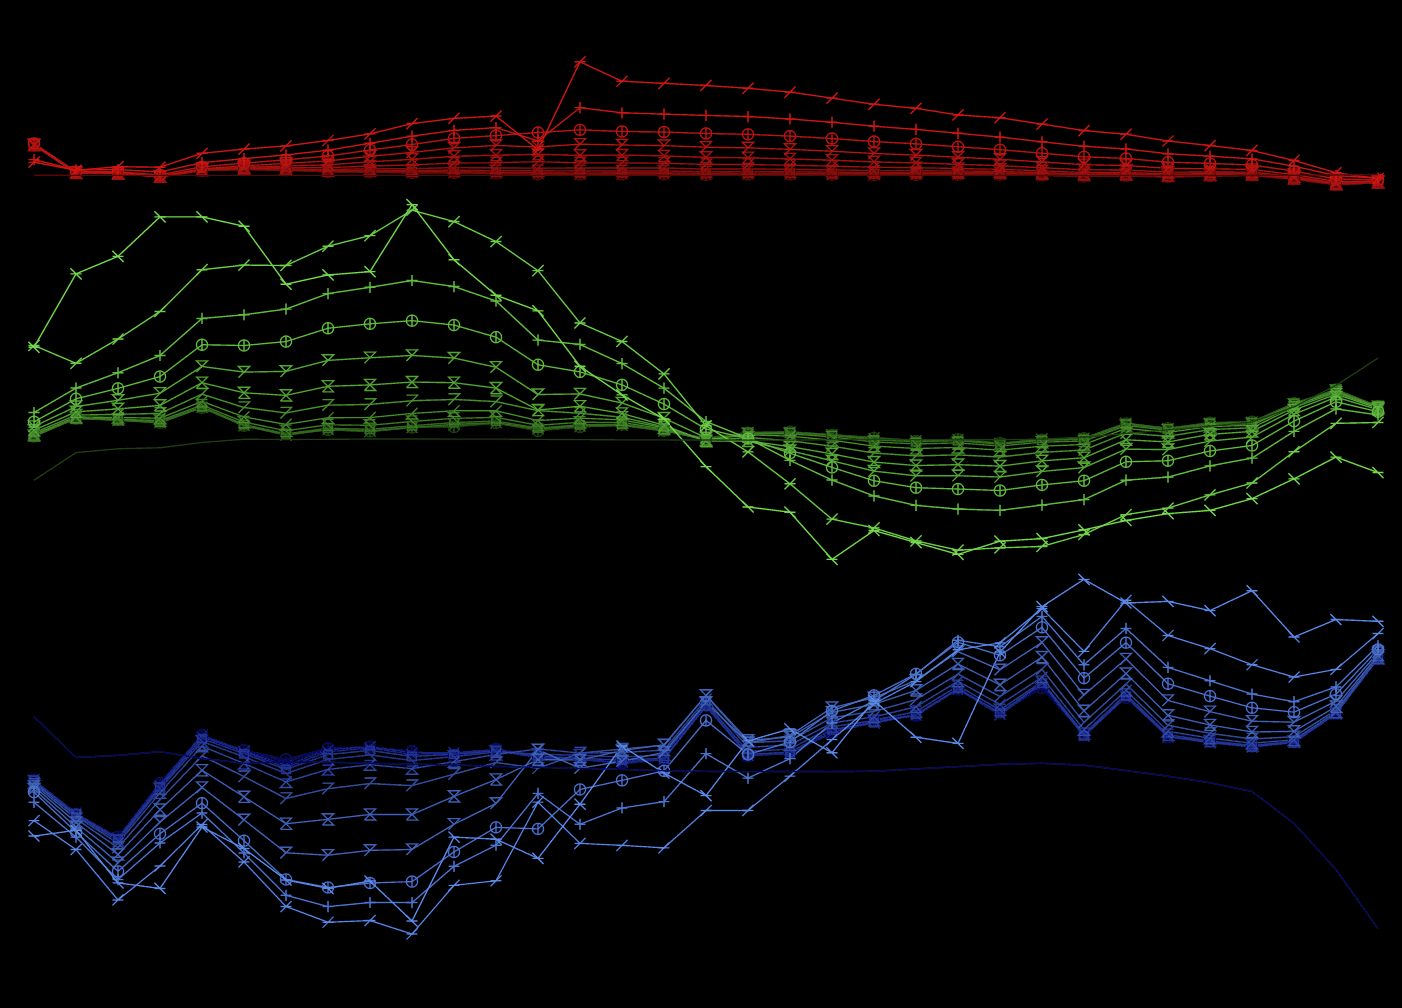
This is a web application that plots electromagnetic (EM) responses from imported files. Referred to simply as "plotter", it is now used as a consulting tool and by clients to plot time domain UTEM data in a web browser. Plotter needed to be capable of plotting downhole and surface data, and orient…
Depth to Water, October 16, 2016
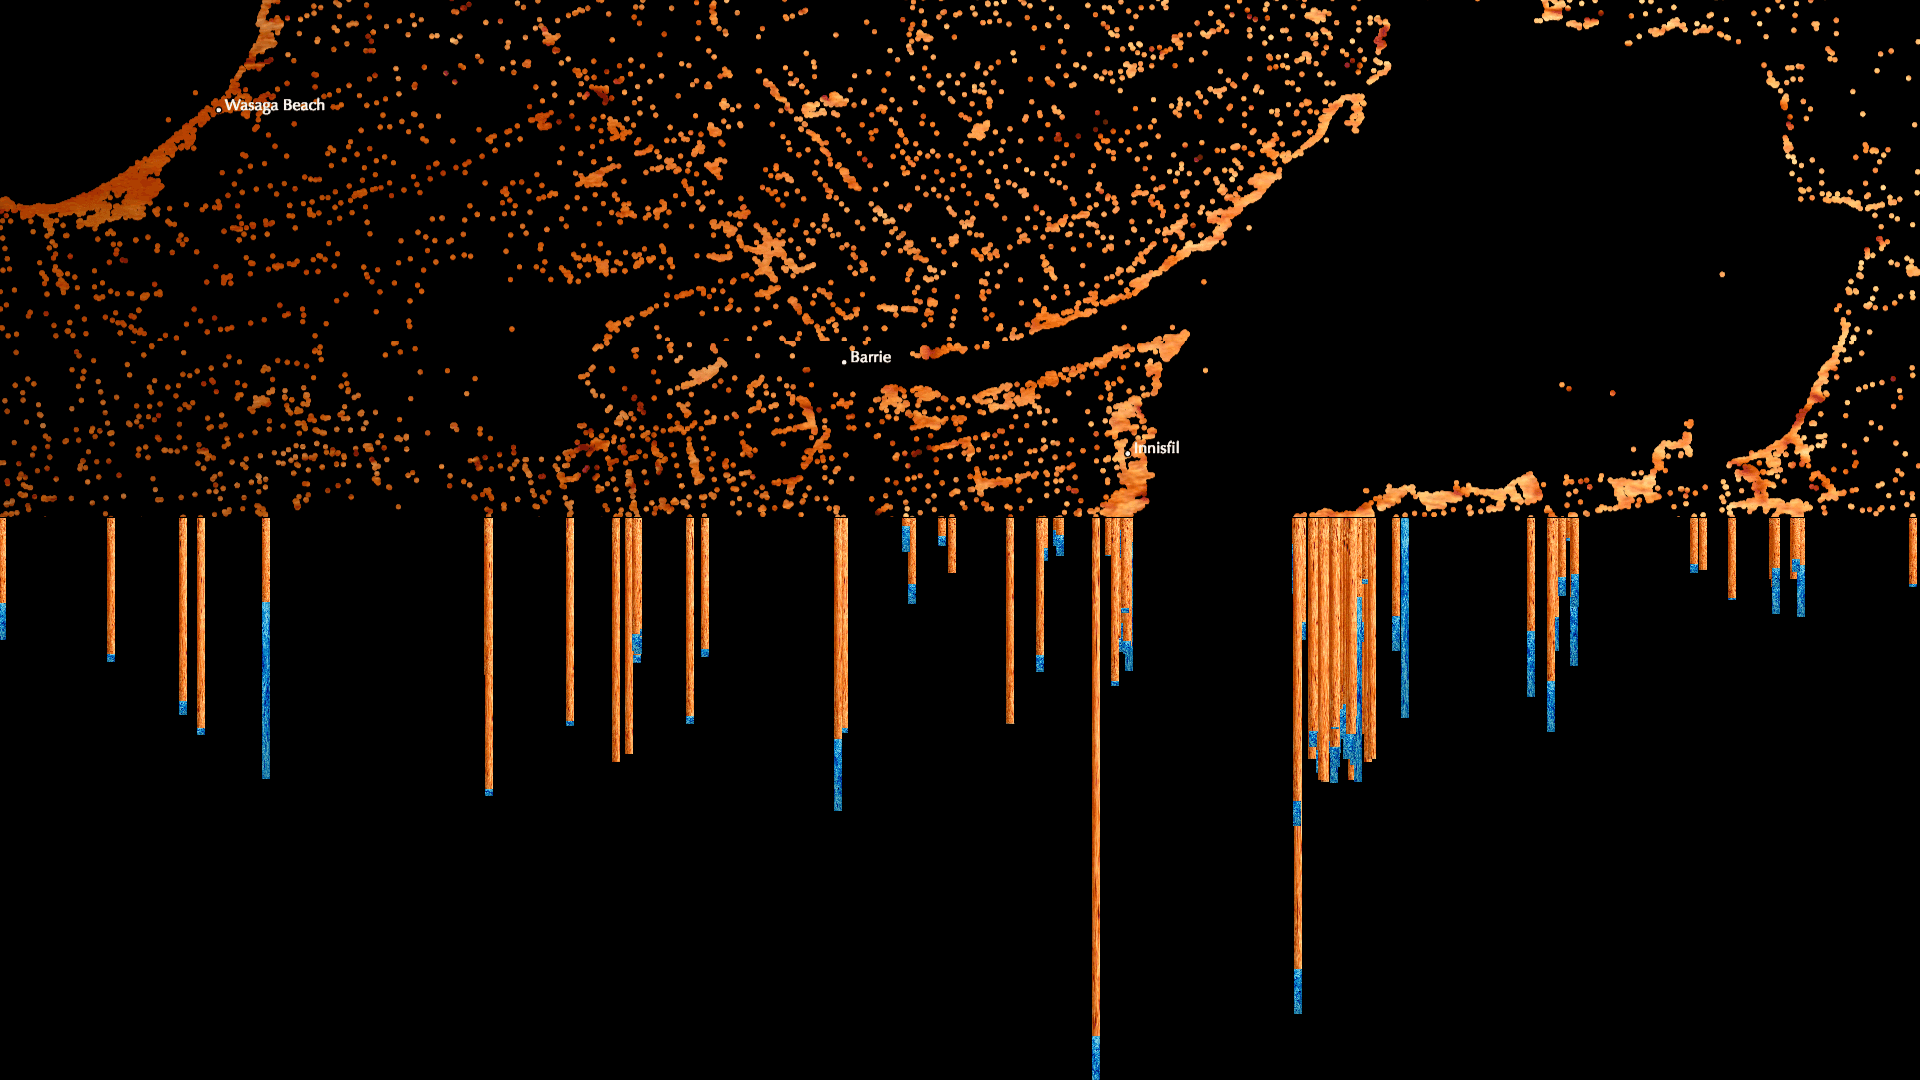
Depth to Water was created for the 17th Canadian National Conference on Drinking Water in Ottawa, Ontario to showcase how 367,089 private-well water data points can map the geography of Southern Ontario, Canada. Additionally, Depth to Water displays the depth at which water was found for each well…
88 Years, Interactive, March 31, 2015
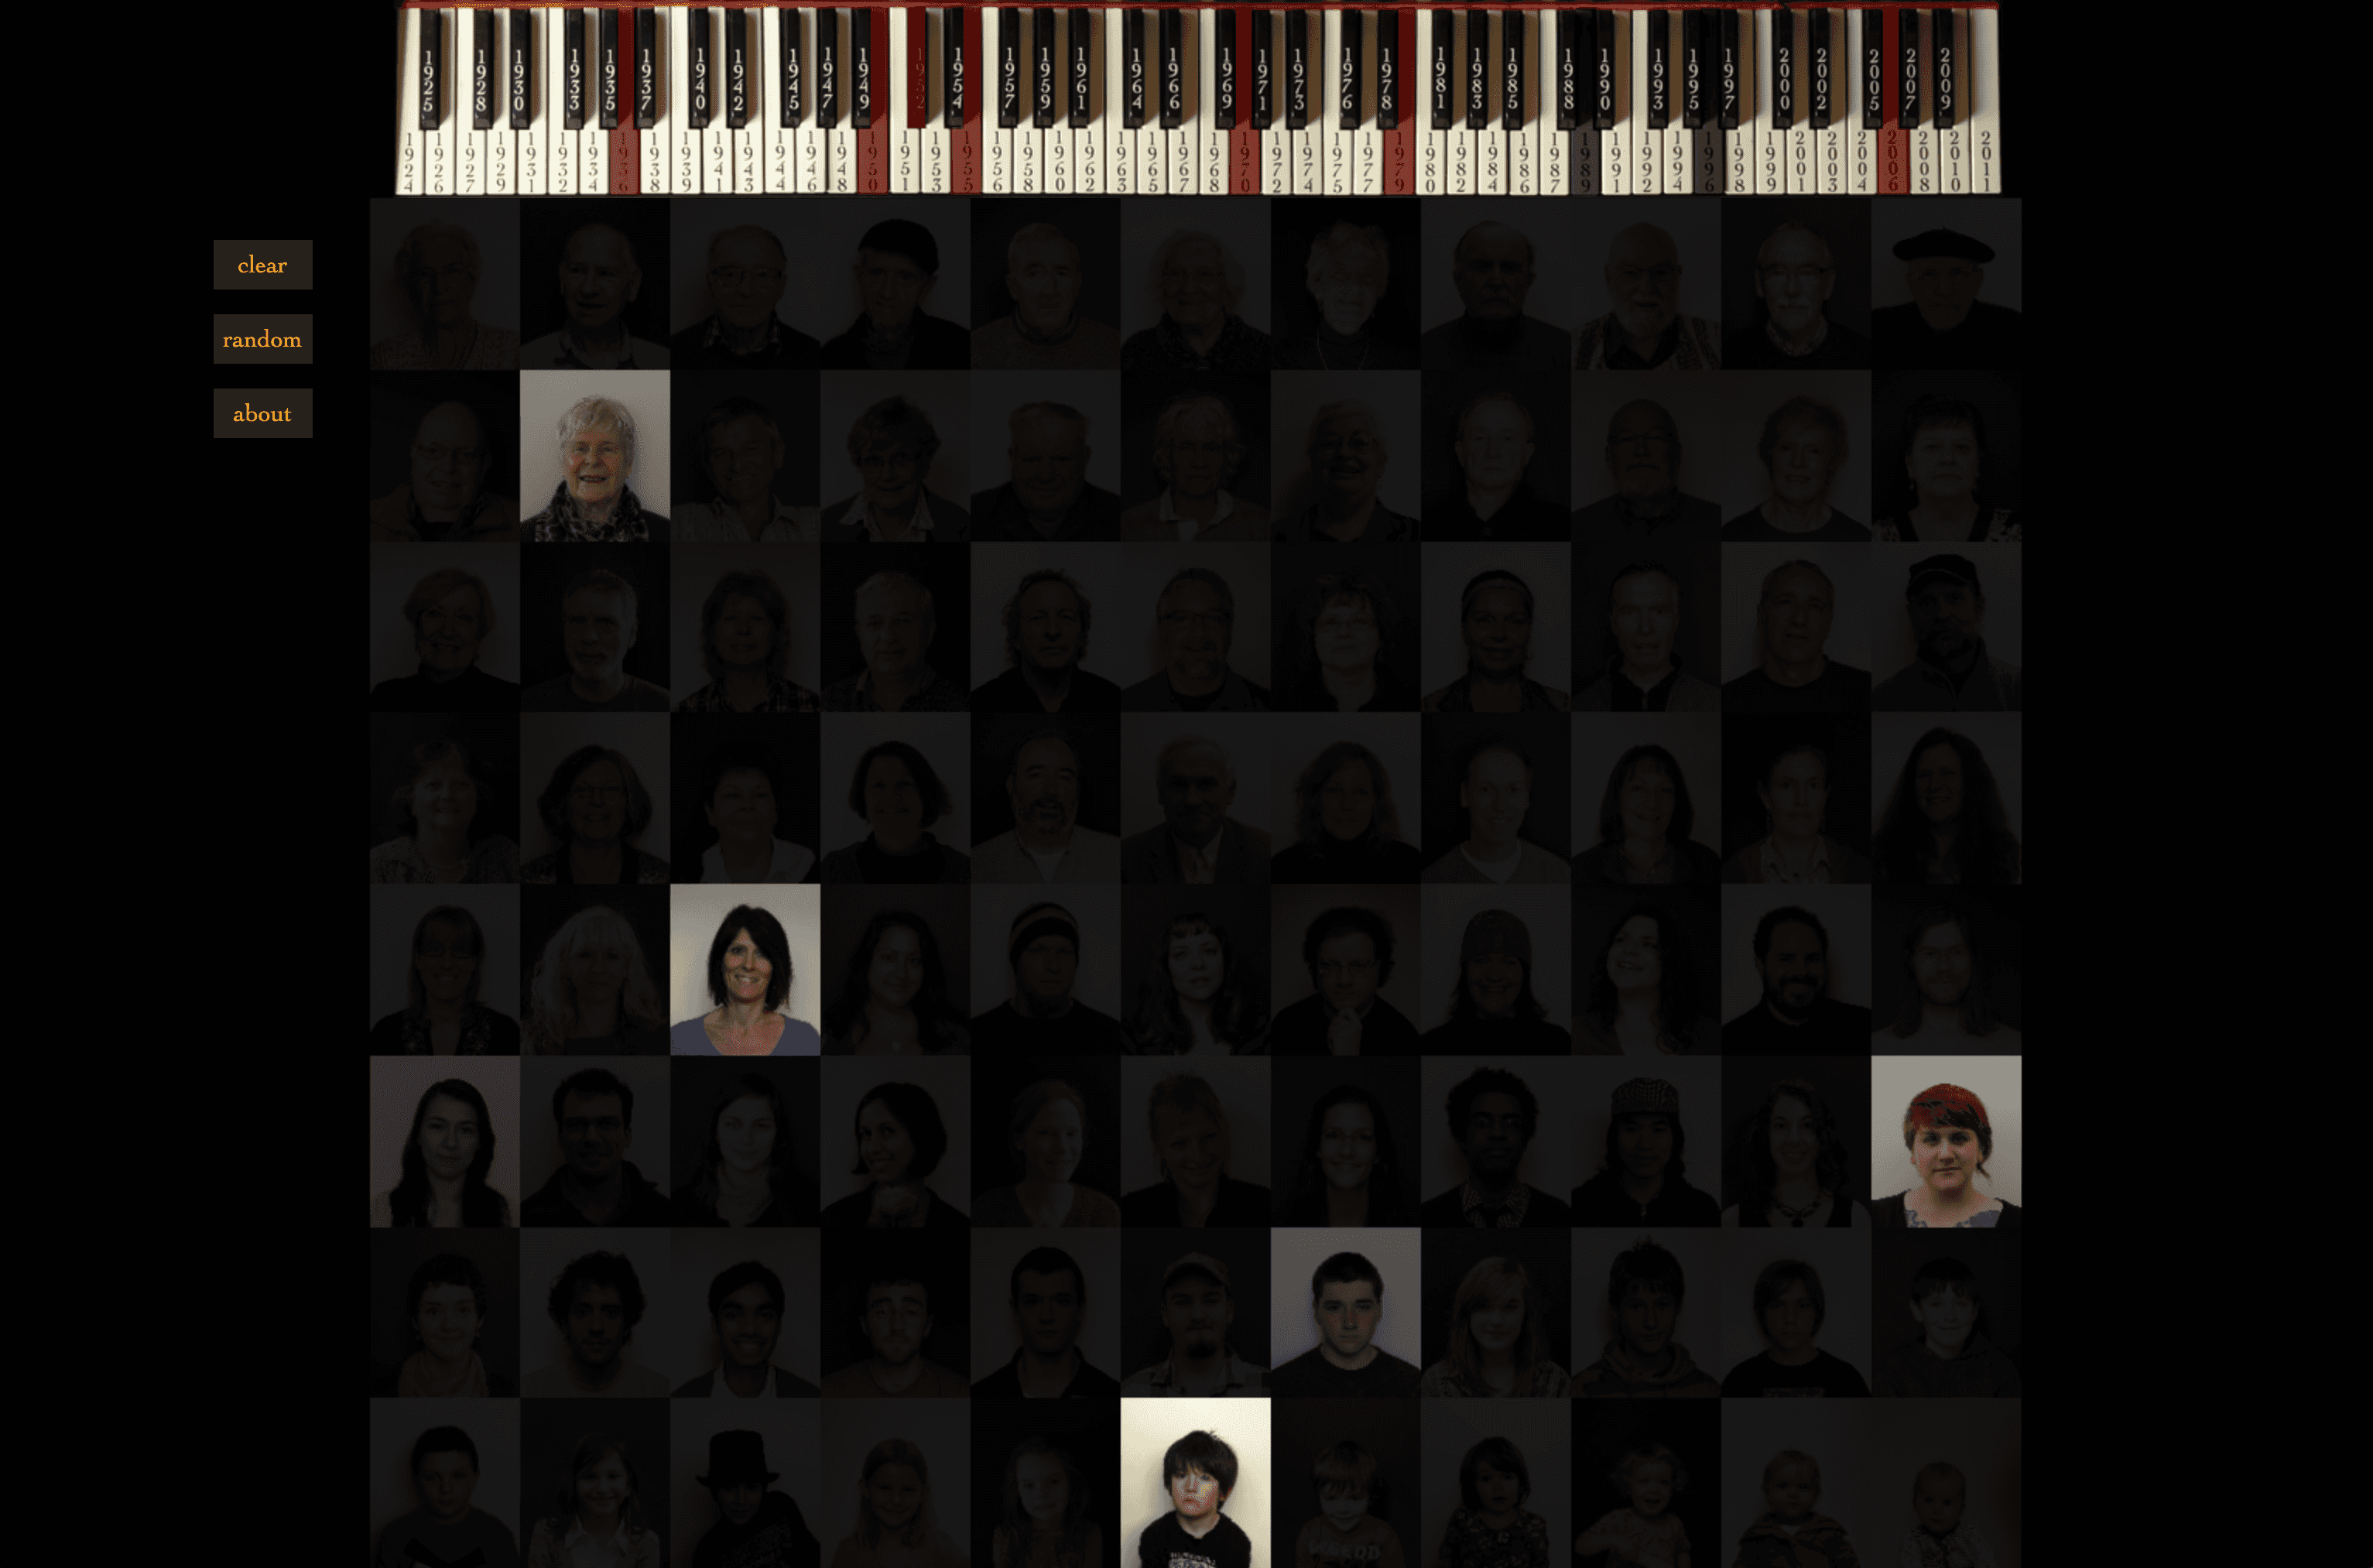
In 2011, Decomposing Pianos met and chronologically depicted 88 individuals to correspond to each key of the piano. The first twenty portraits were displayed at the State of Flux Gallery on March 26, 2011 to showcase the work in progress. The display featured groups of portraits connected to…
Intersection, September 05, 2014
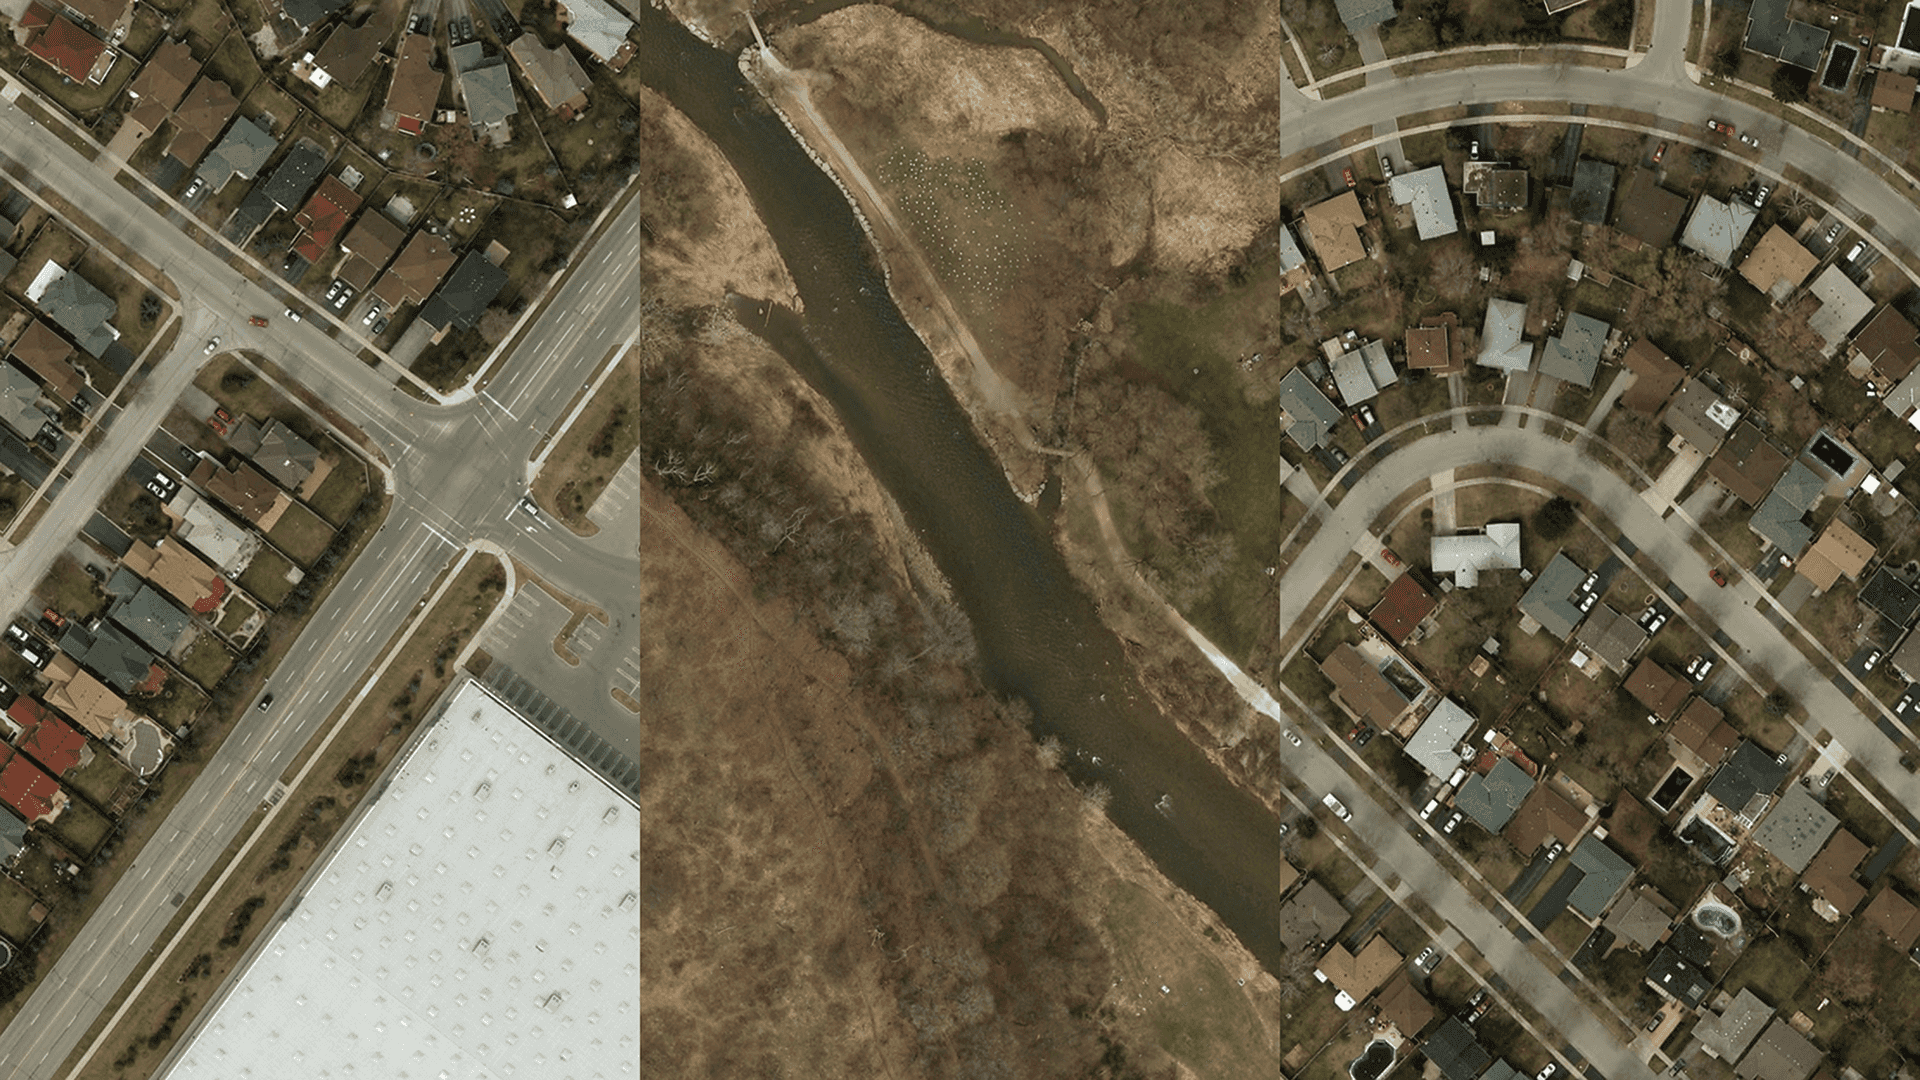
Originally created for an exhibition with the Agitated Plovers Salon, Intersection went on to win the Canadian Urbanism Award at the Toronto Urban Film Festival (TUFF) in September 2014, and was subsequently displayed across Toronto Subway stations in May 2015. Randomly displaying images from a set…
Cognitive Dissonance - 3D radio, August 11, 2014
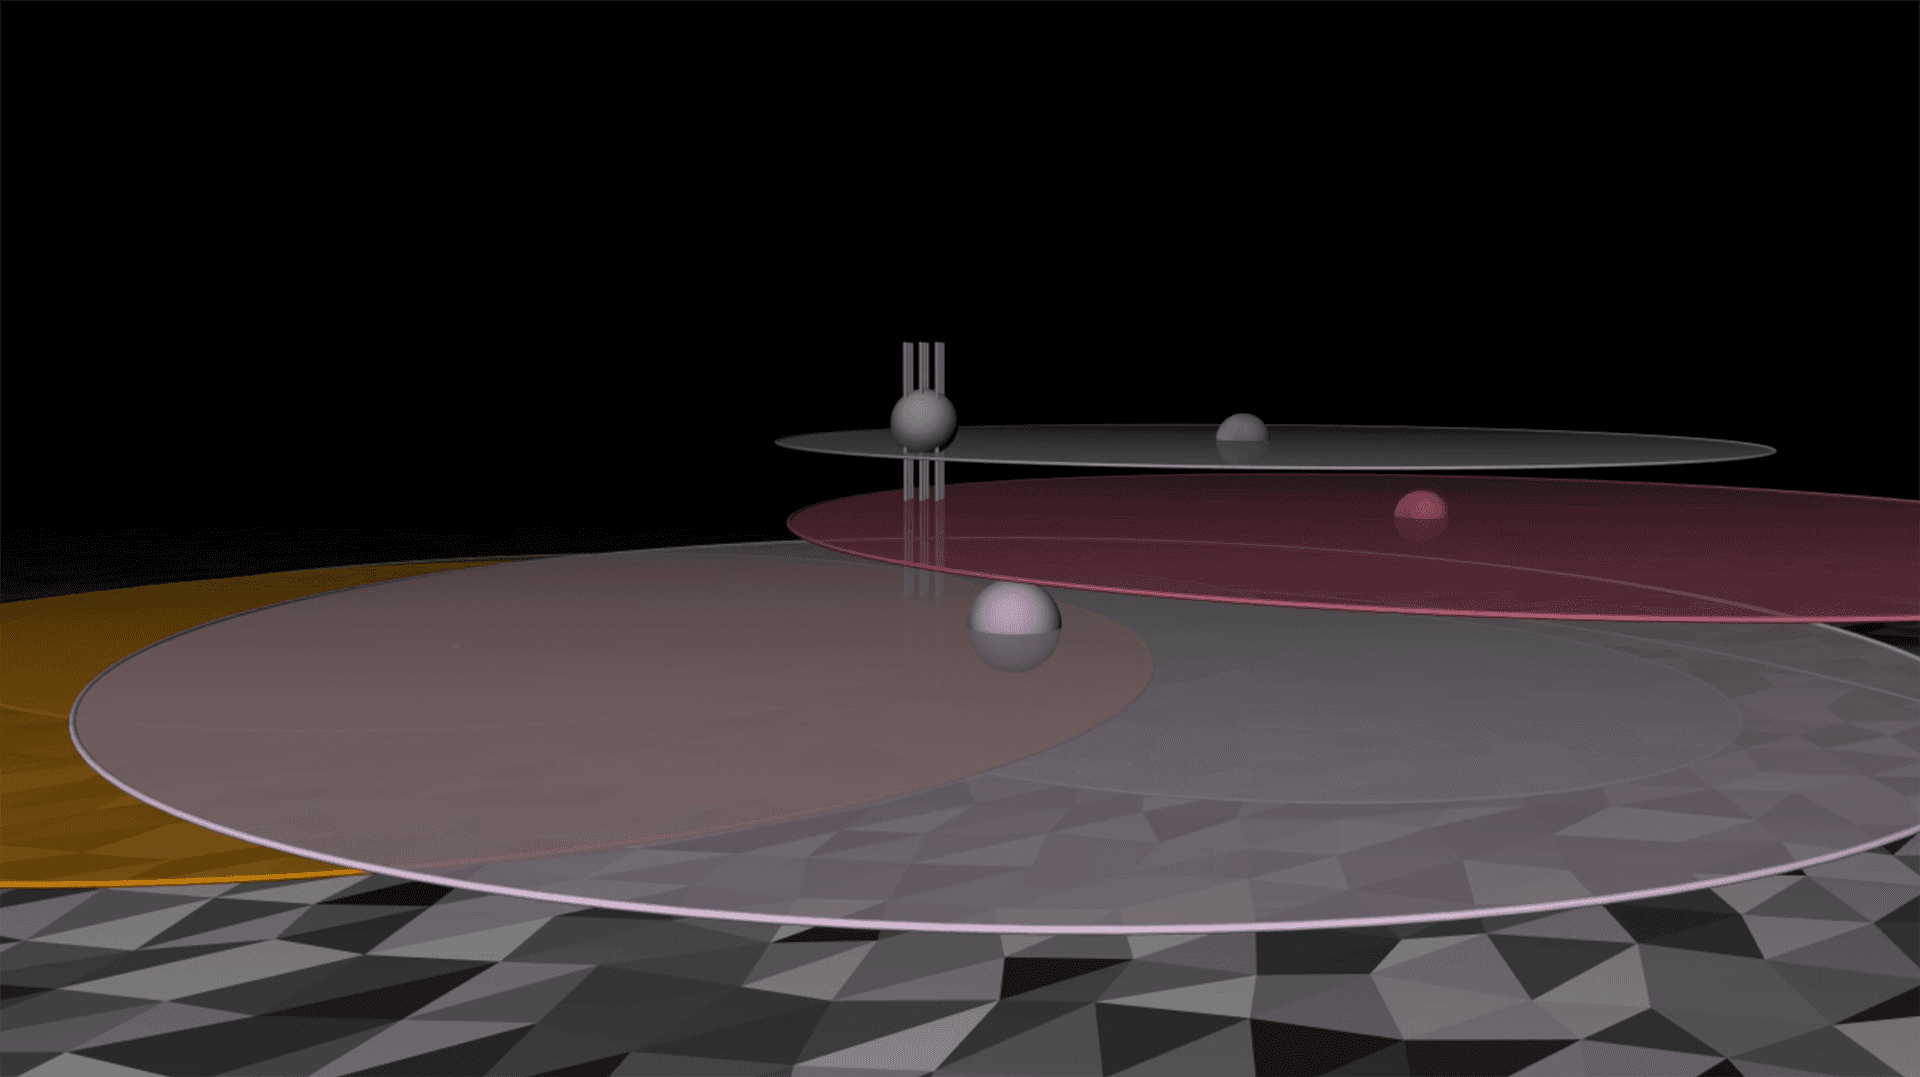
This is a live screening that took place at the Screening Room in Kingston, Ontario. It features visual 3D radio clips on the meaning of music, as collected by my friend and colleague Chris Trimmer. 3D space is navigated using three.js pointer lock controls. Audio is emitted using webAudio panner…
o1sound, Radio Blog 2008,2009 and 2012, August 31, 2012
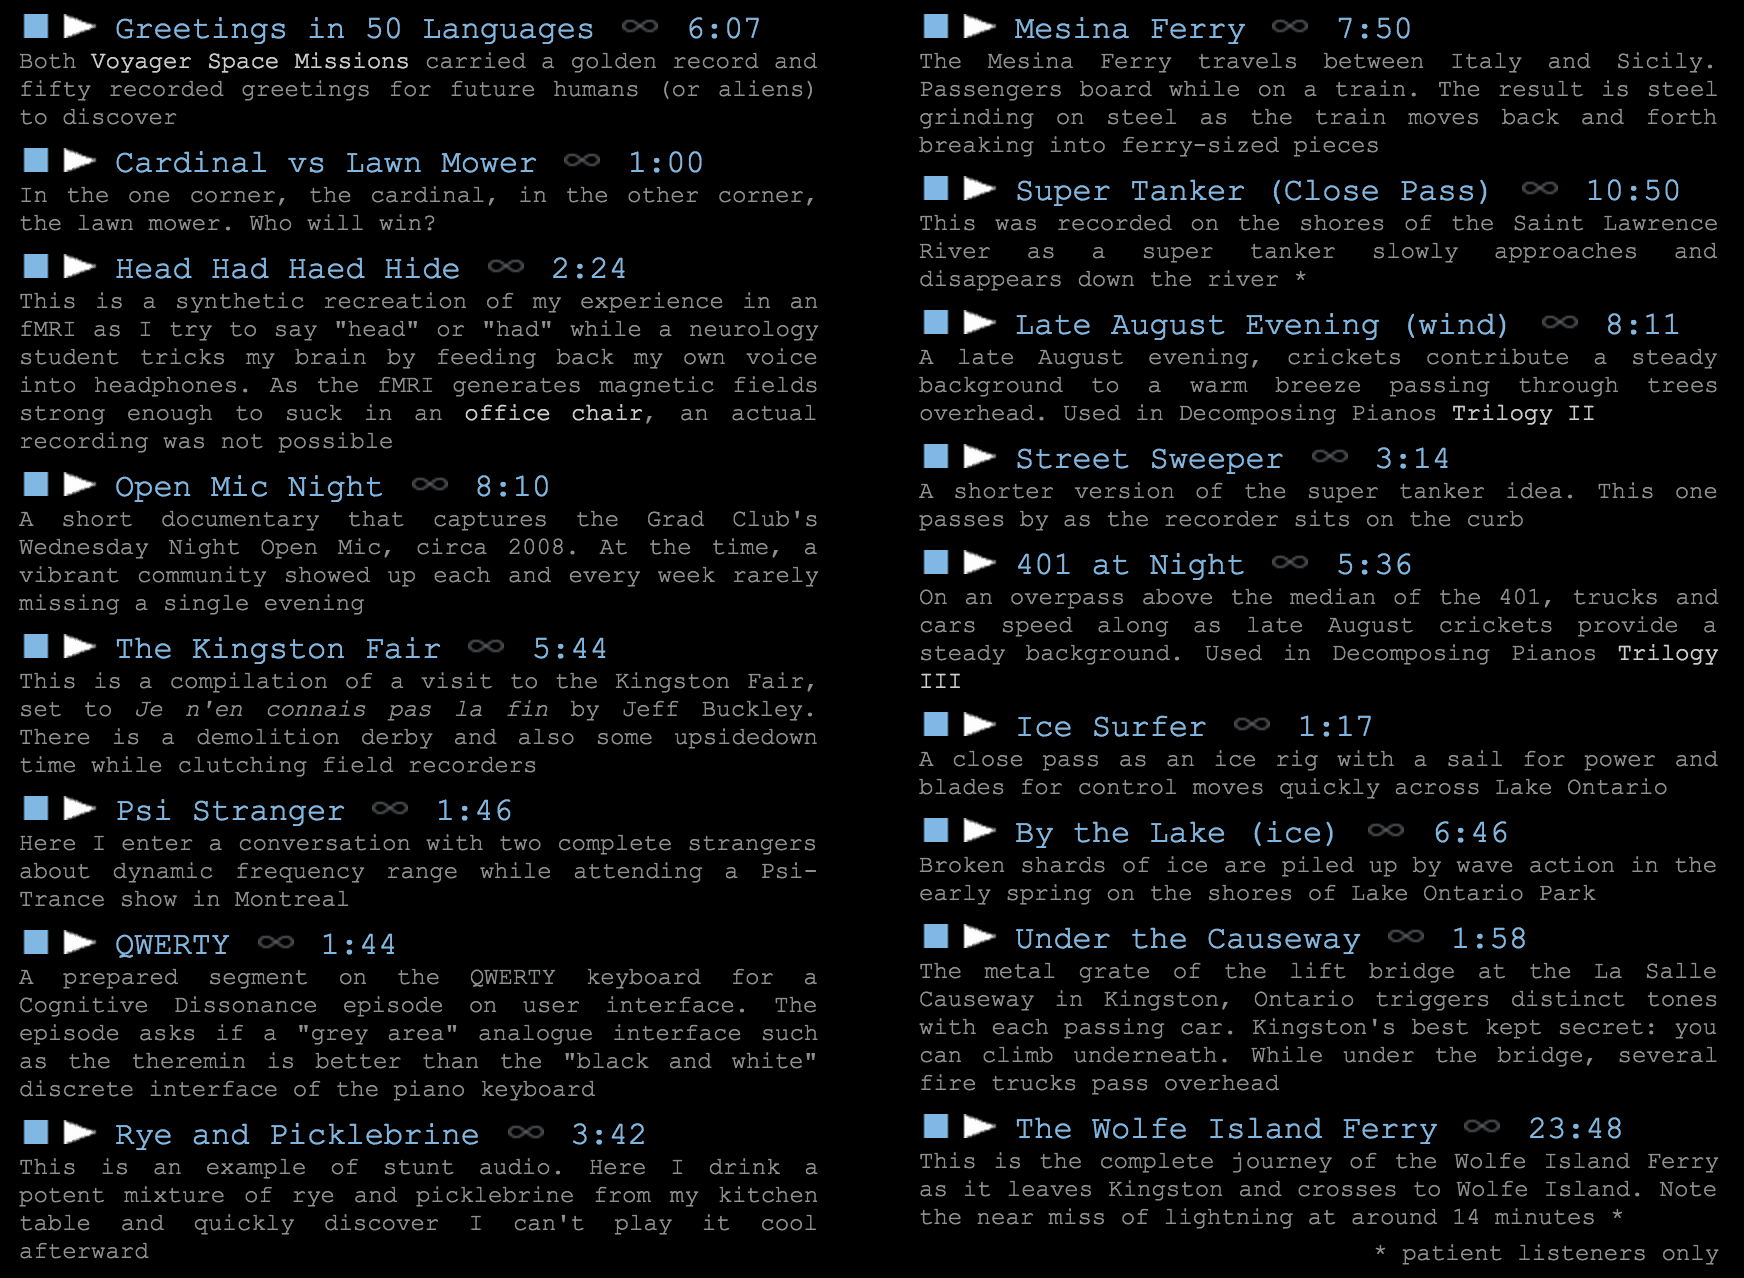
o1sound was an hour long weekly radio show on CFRC 101.9 FM, Queen's University Campus Community radio during the summer of 2008 and 2009. During the week incidental events were recorded as they happened. The results were edited, and played back every Tuesday morning after the BBC world news. The…