Scalable Vector Graphics (SVG) is an XML-based markup language for describing two dimensional based vector graphics. SVG is essentially to graphics what HTML is to text.
Taped Together, June 25, 2021
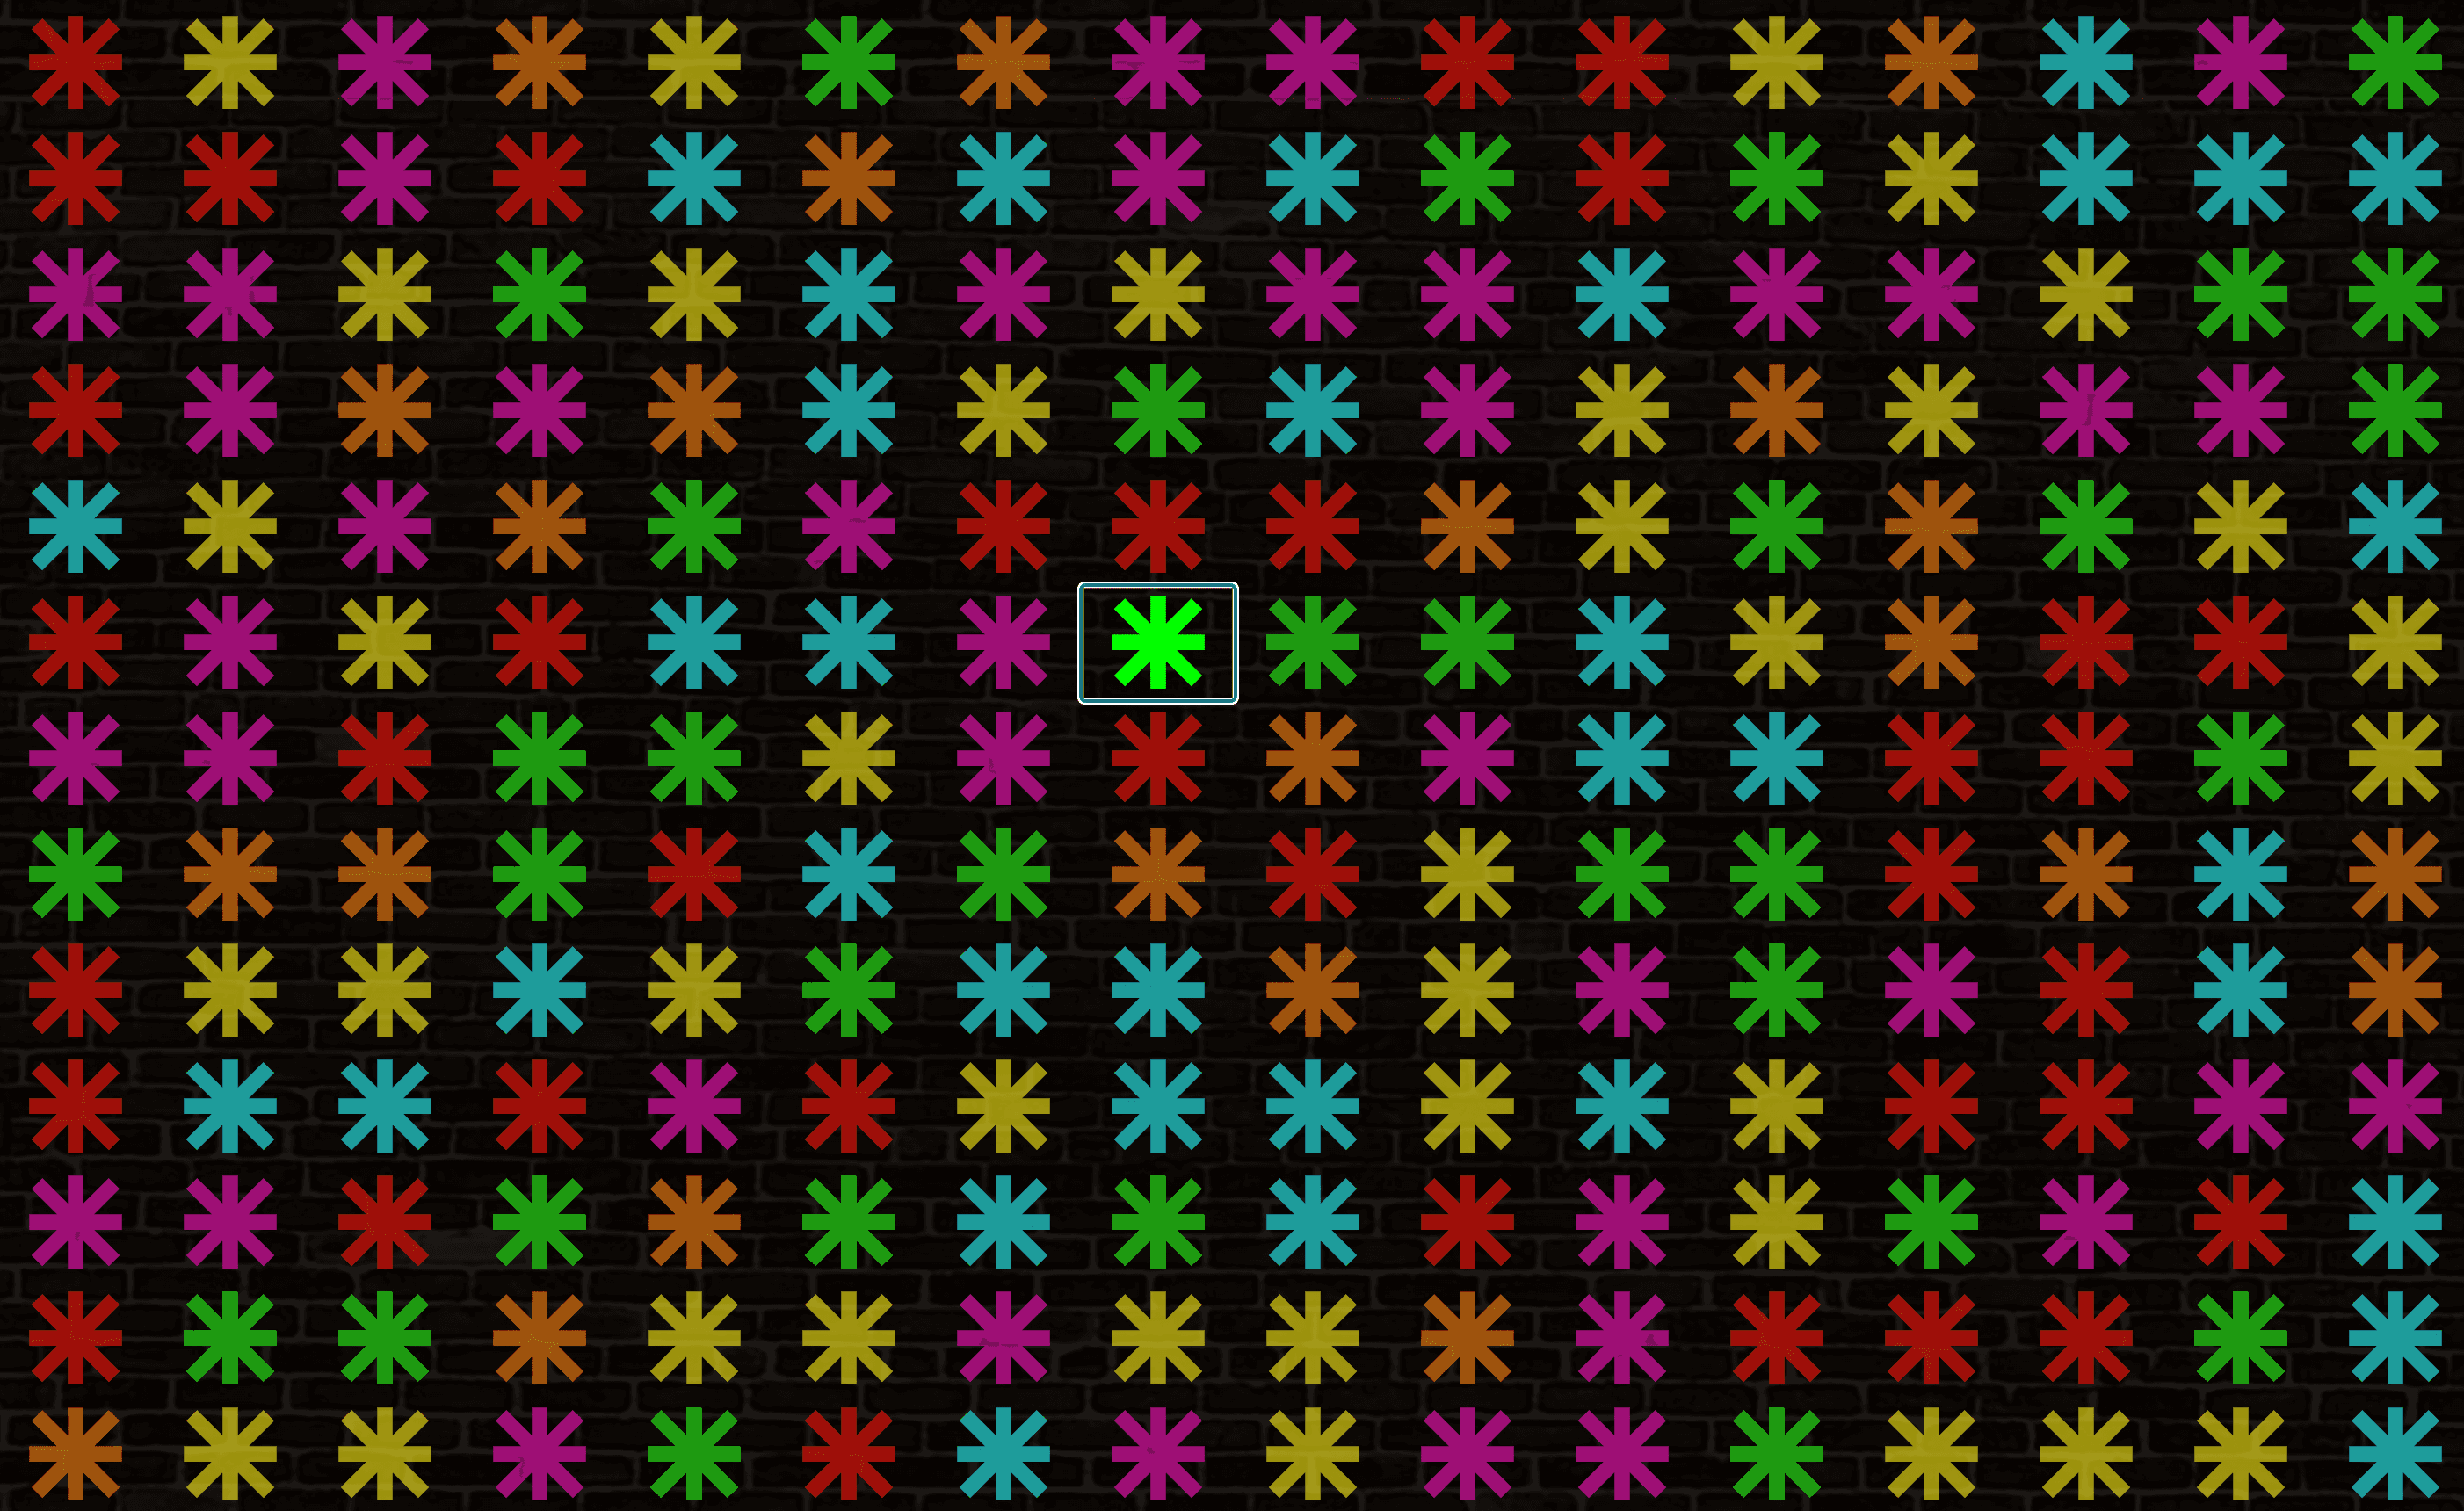
Taped Together was a collection of publicly submitted responses to the prompt "I am getting vaccinated because...". It is inspired by the work of artist Mark Reinhart’s duct tape graffiti on city buildings, who during the COVID-19 pandemic connected the community with bright coloured messages of…
POLLEN - Slack App, April 08, 2021
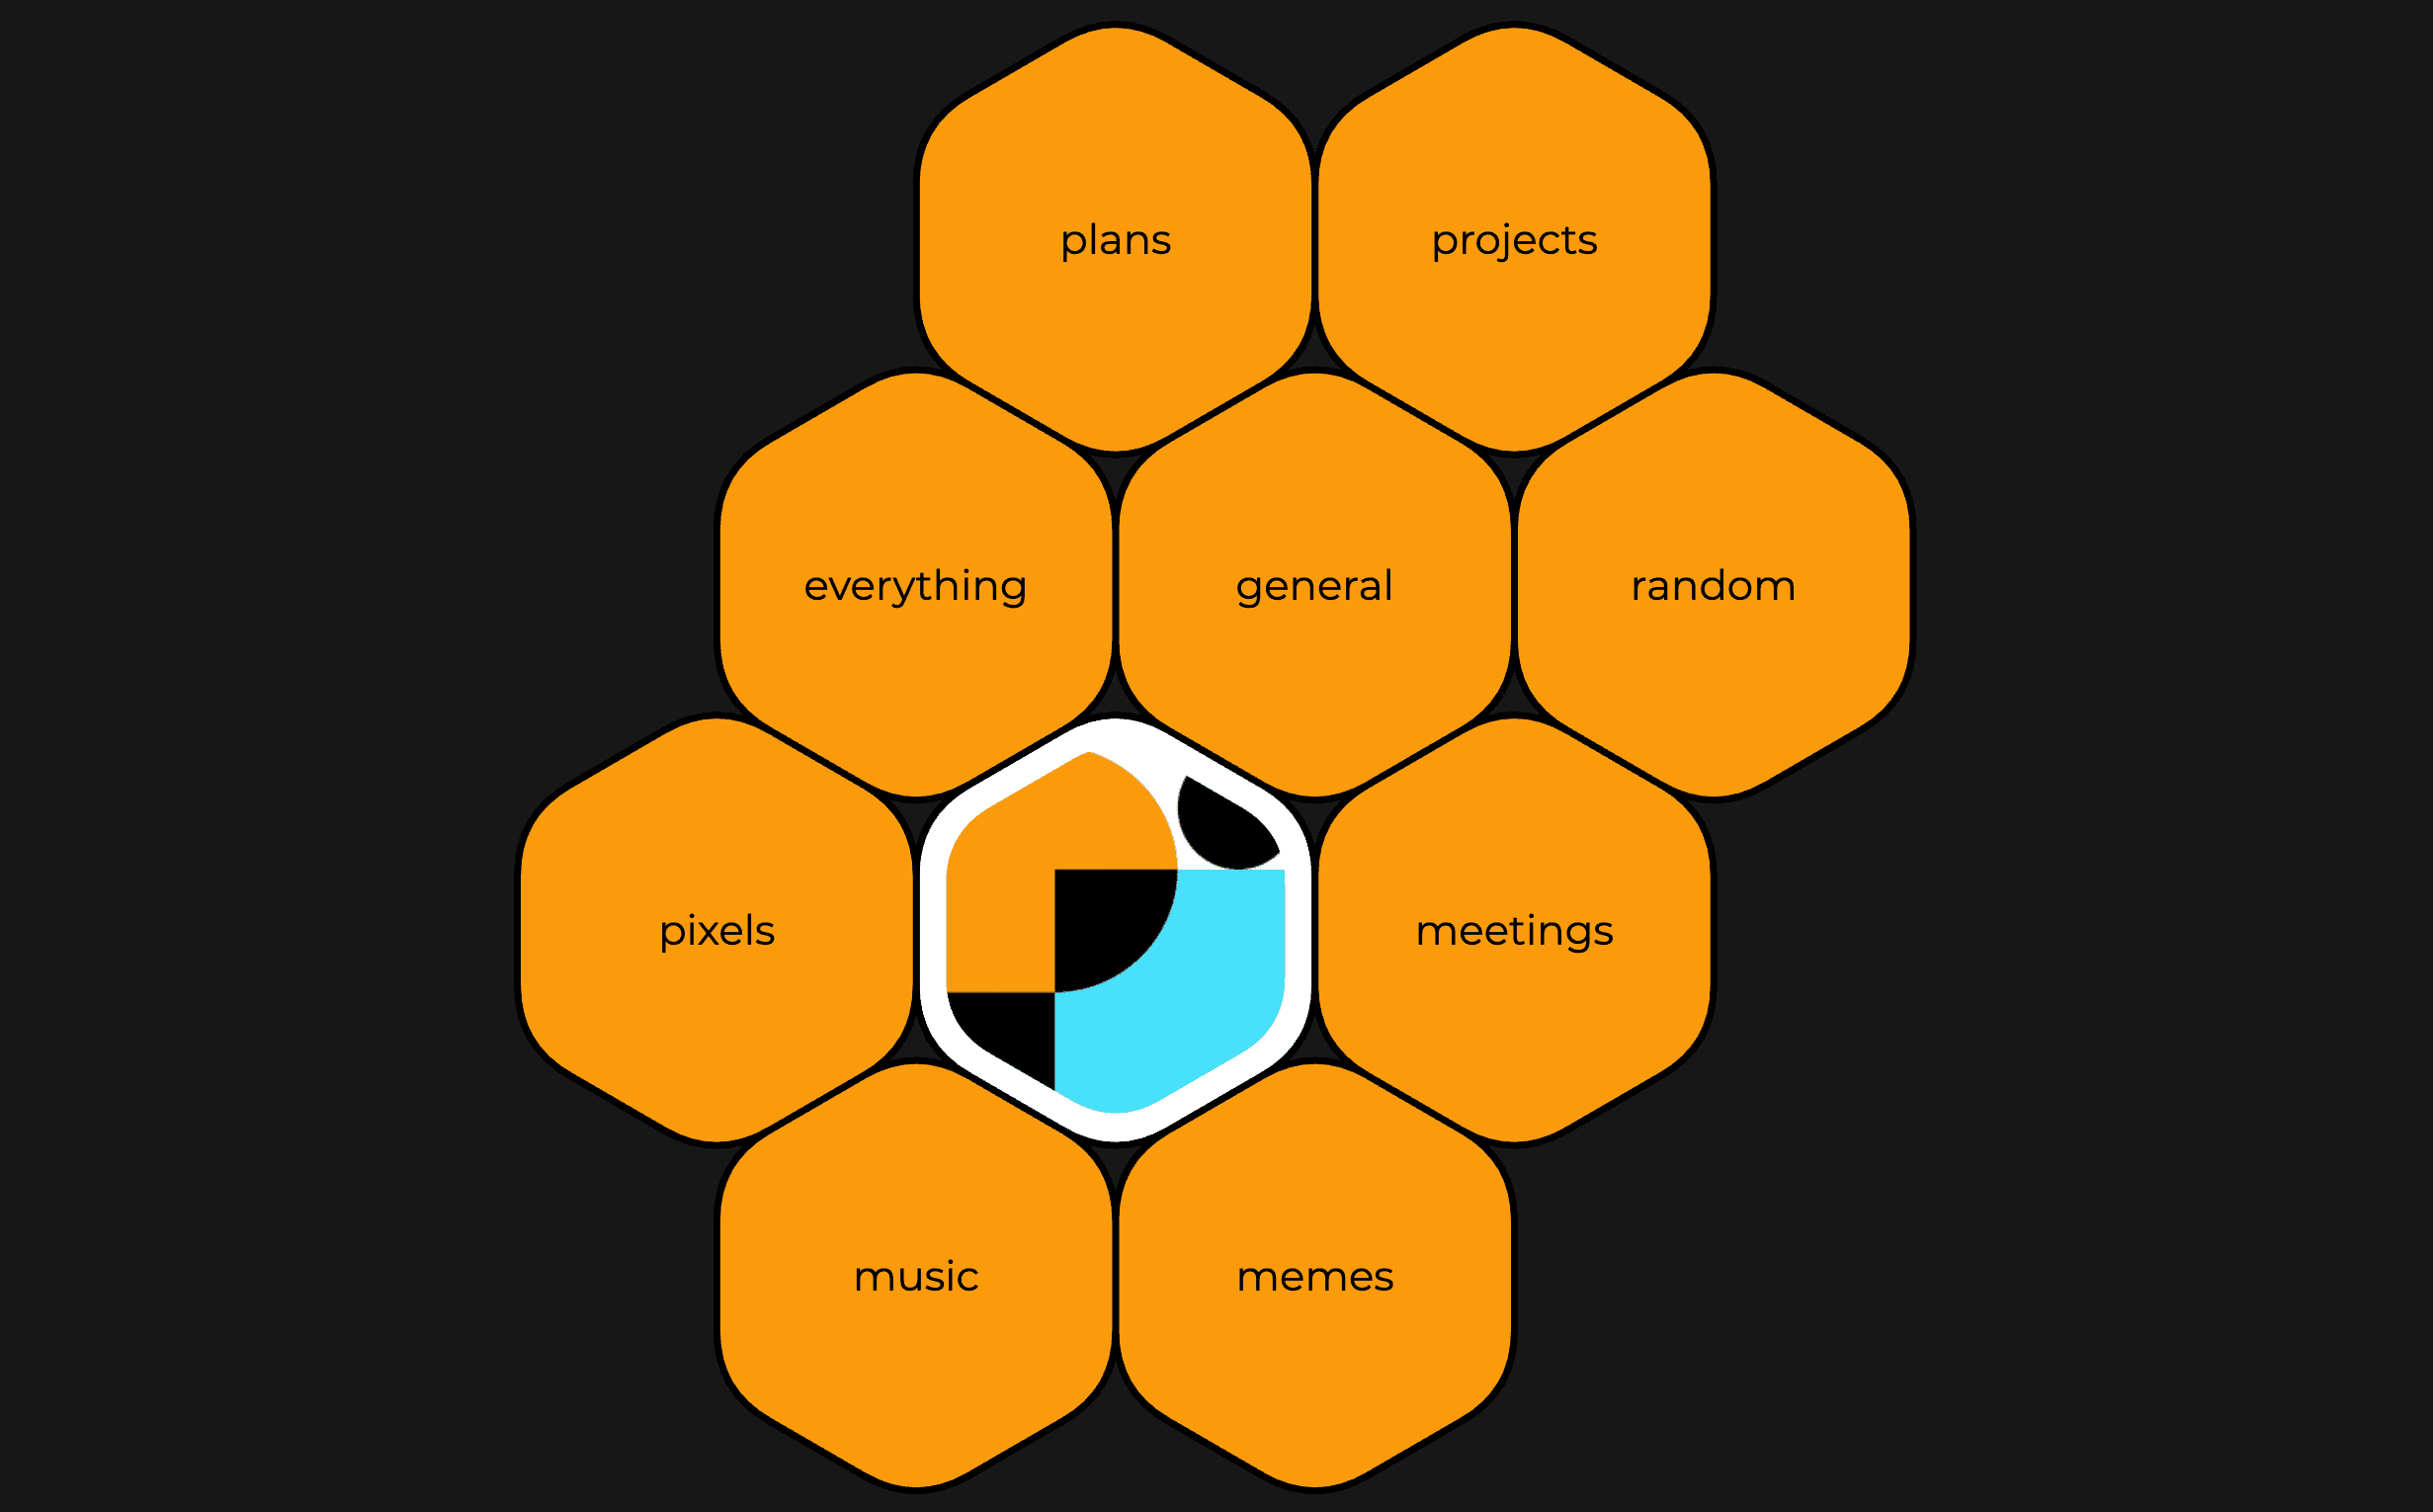
POLLEN started as an idea to visualize Slack workspace channels for the Data Visualization Society. The society has over 70 channels and it was difficult for members to get a sense of the channel landscape and the amazing discussions. Working to solve this problem quickly evolved into creating a new…
CSUCH - Data Visualizer, March 22, 2019
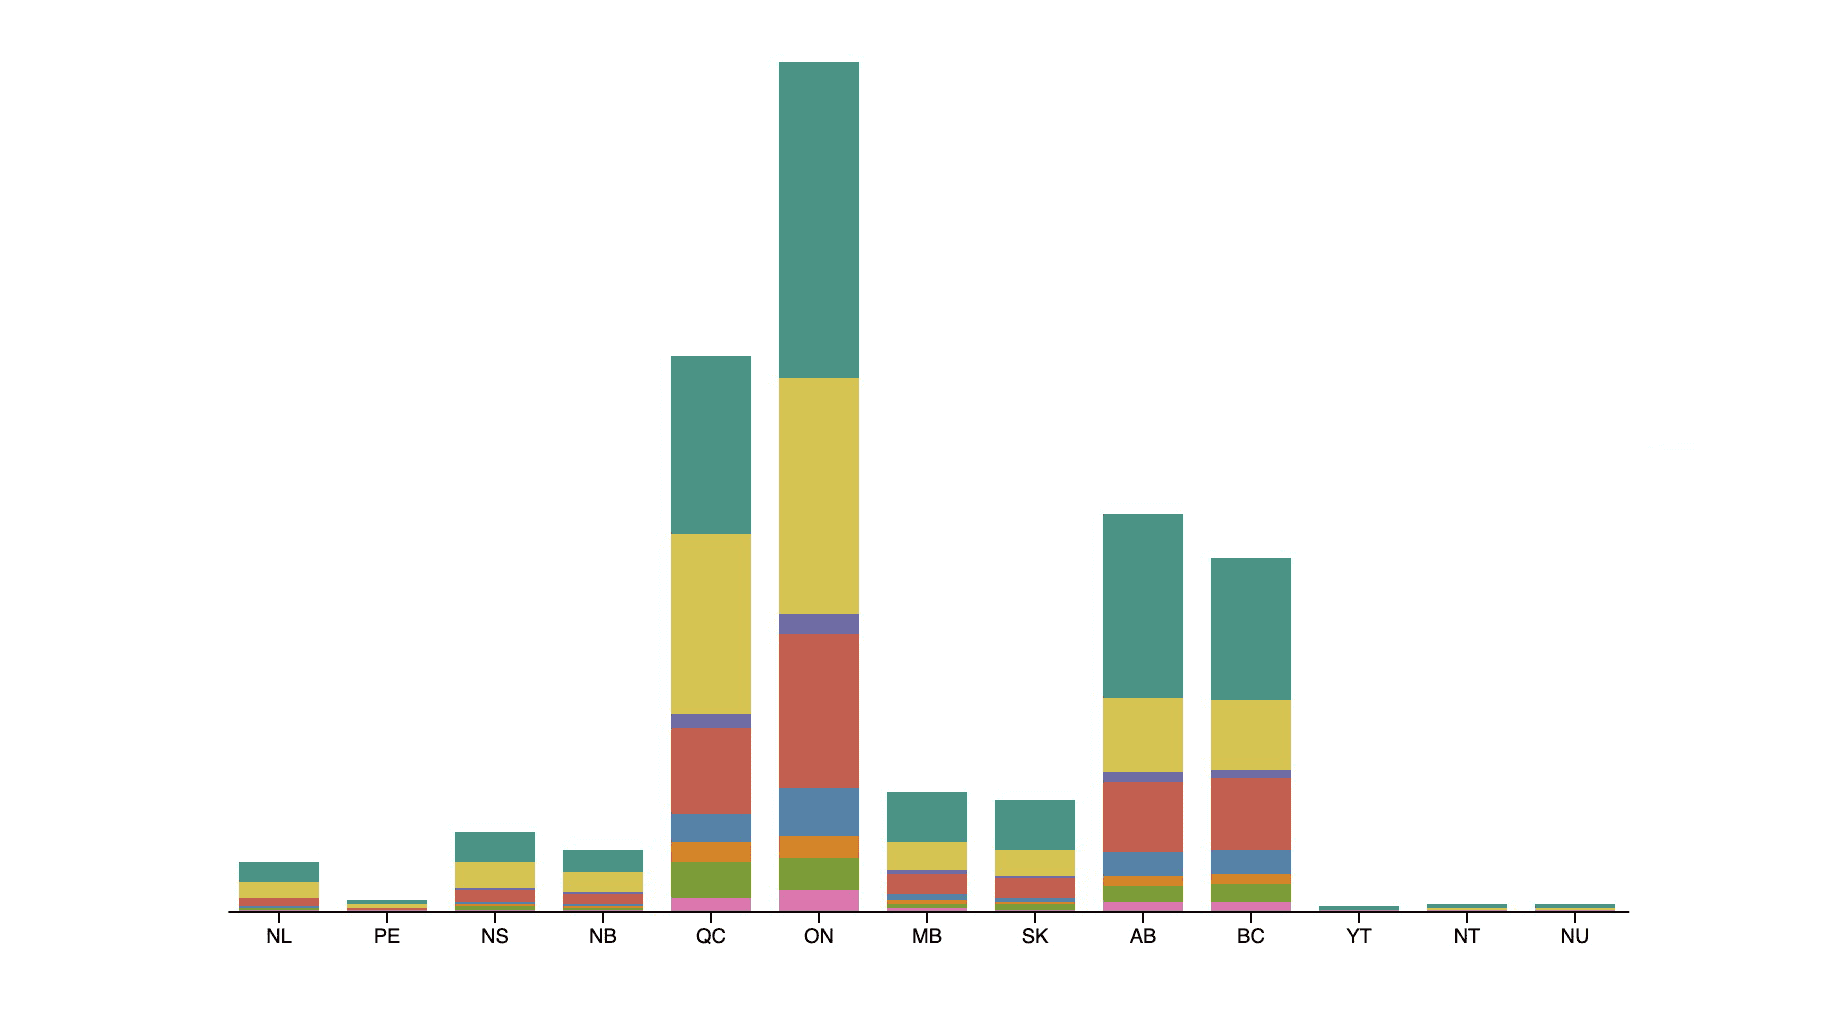
This data visualization tool displays the costs and harms of substance use in Canada, and offers options to filter and compare the data to better explore and understand trends and changes in how Canada spends its resources on substance use and addiction. This data is provided by Canadian Substance…
Community Flow, March 13, 2018
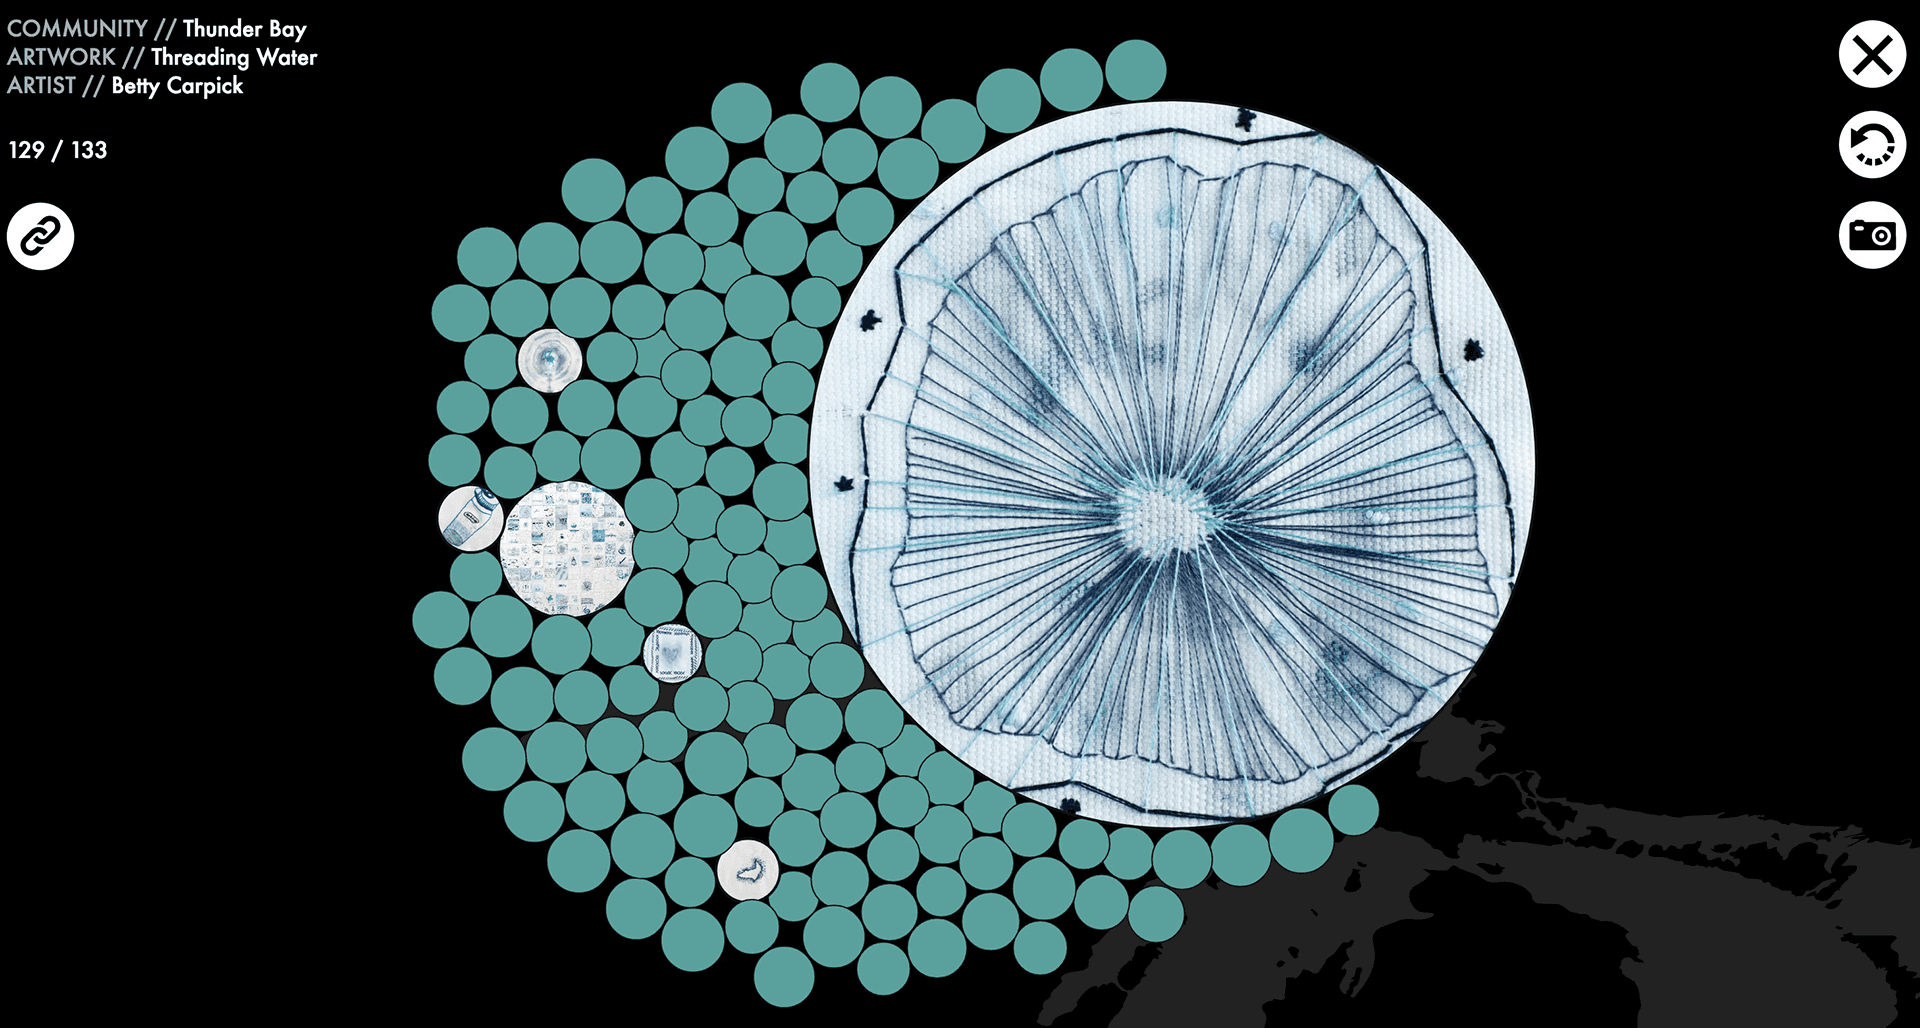
Community Flow was created to bring together artworks from eight communities on the Canadian side of the Great Lakes. Each community had an artist work alongside volunteers to create one artwork from many smaller contributions. This project was to feature each of the final artworks, as well as the…
Hyasynth Bio, January 18, 2018
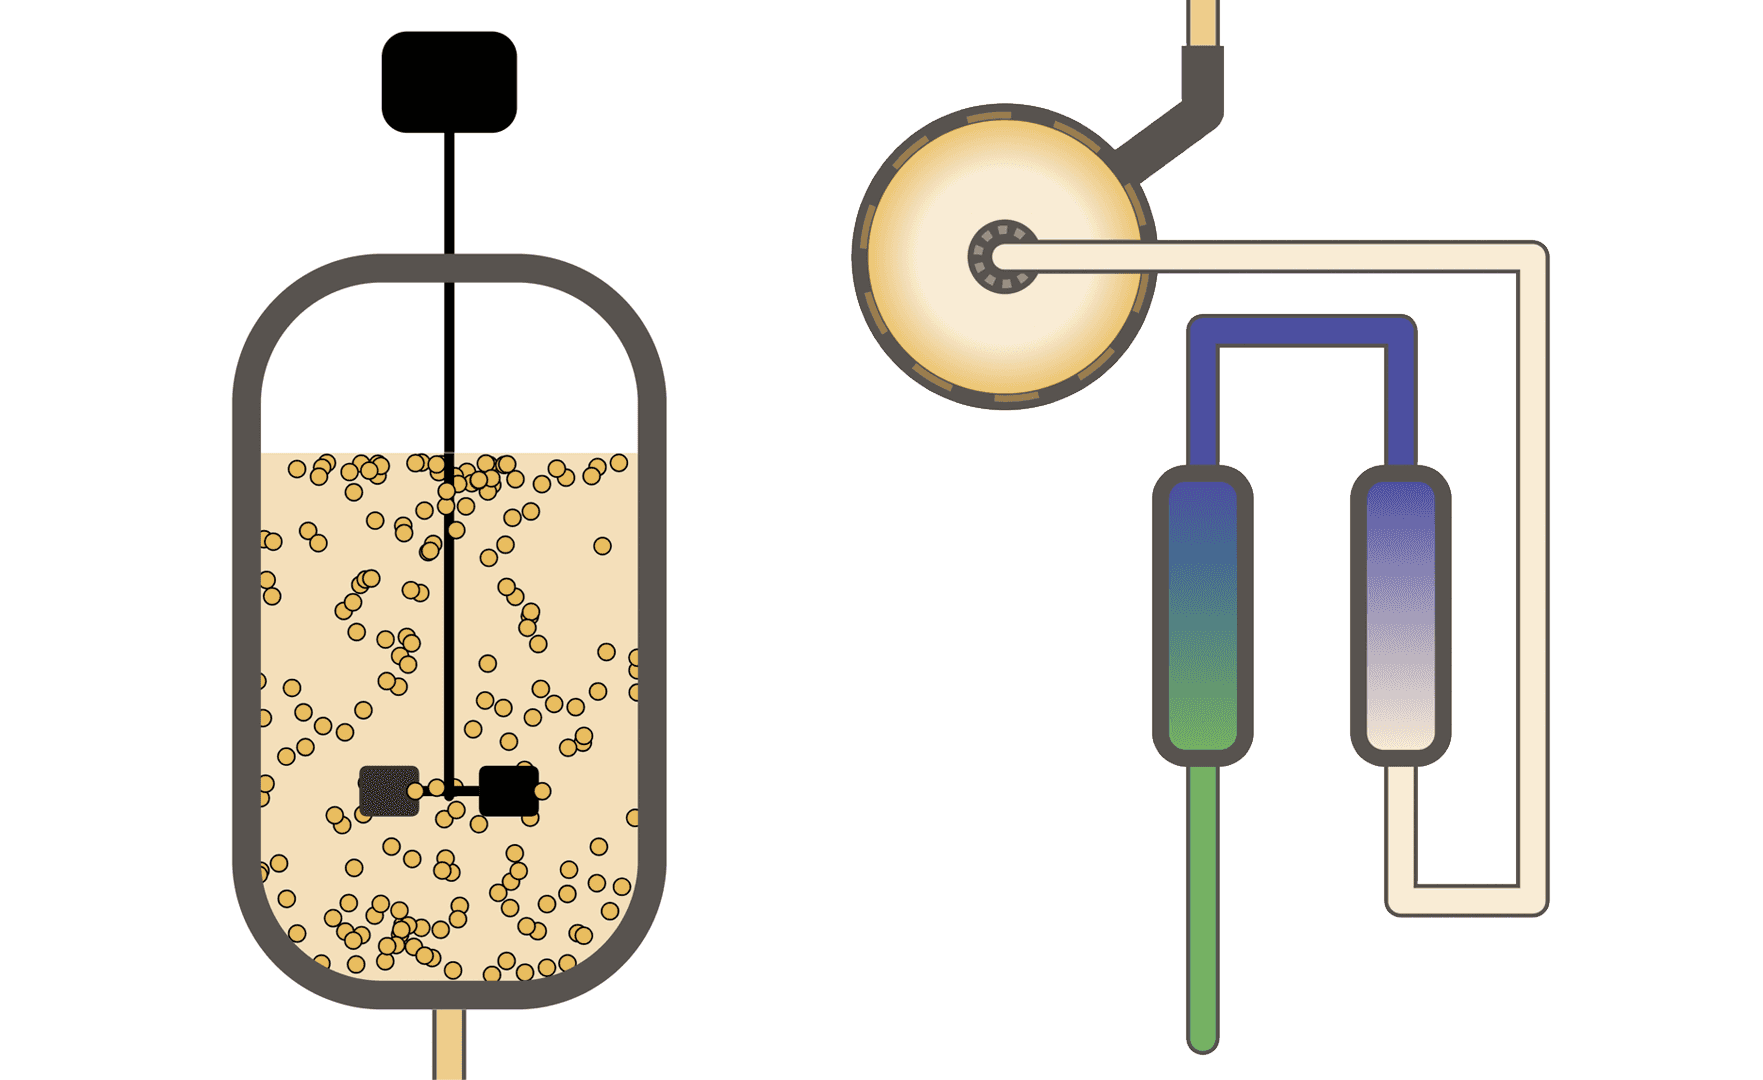
Hyasynth Bio (Montréal, QC) contacted us to see if we would be interested in describing their industrial process they use to produce synthetic cannabis. A scroll story was created that allowed visitors to their site to follow the process from raw ingredients to finished products. One of the main…
Tuberculosis Sample Study, November 23, 2016
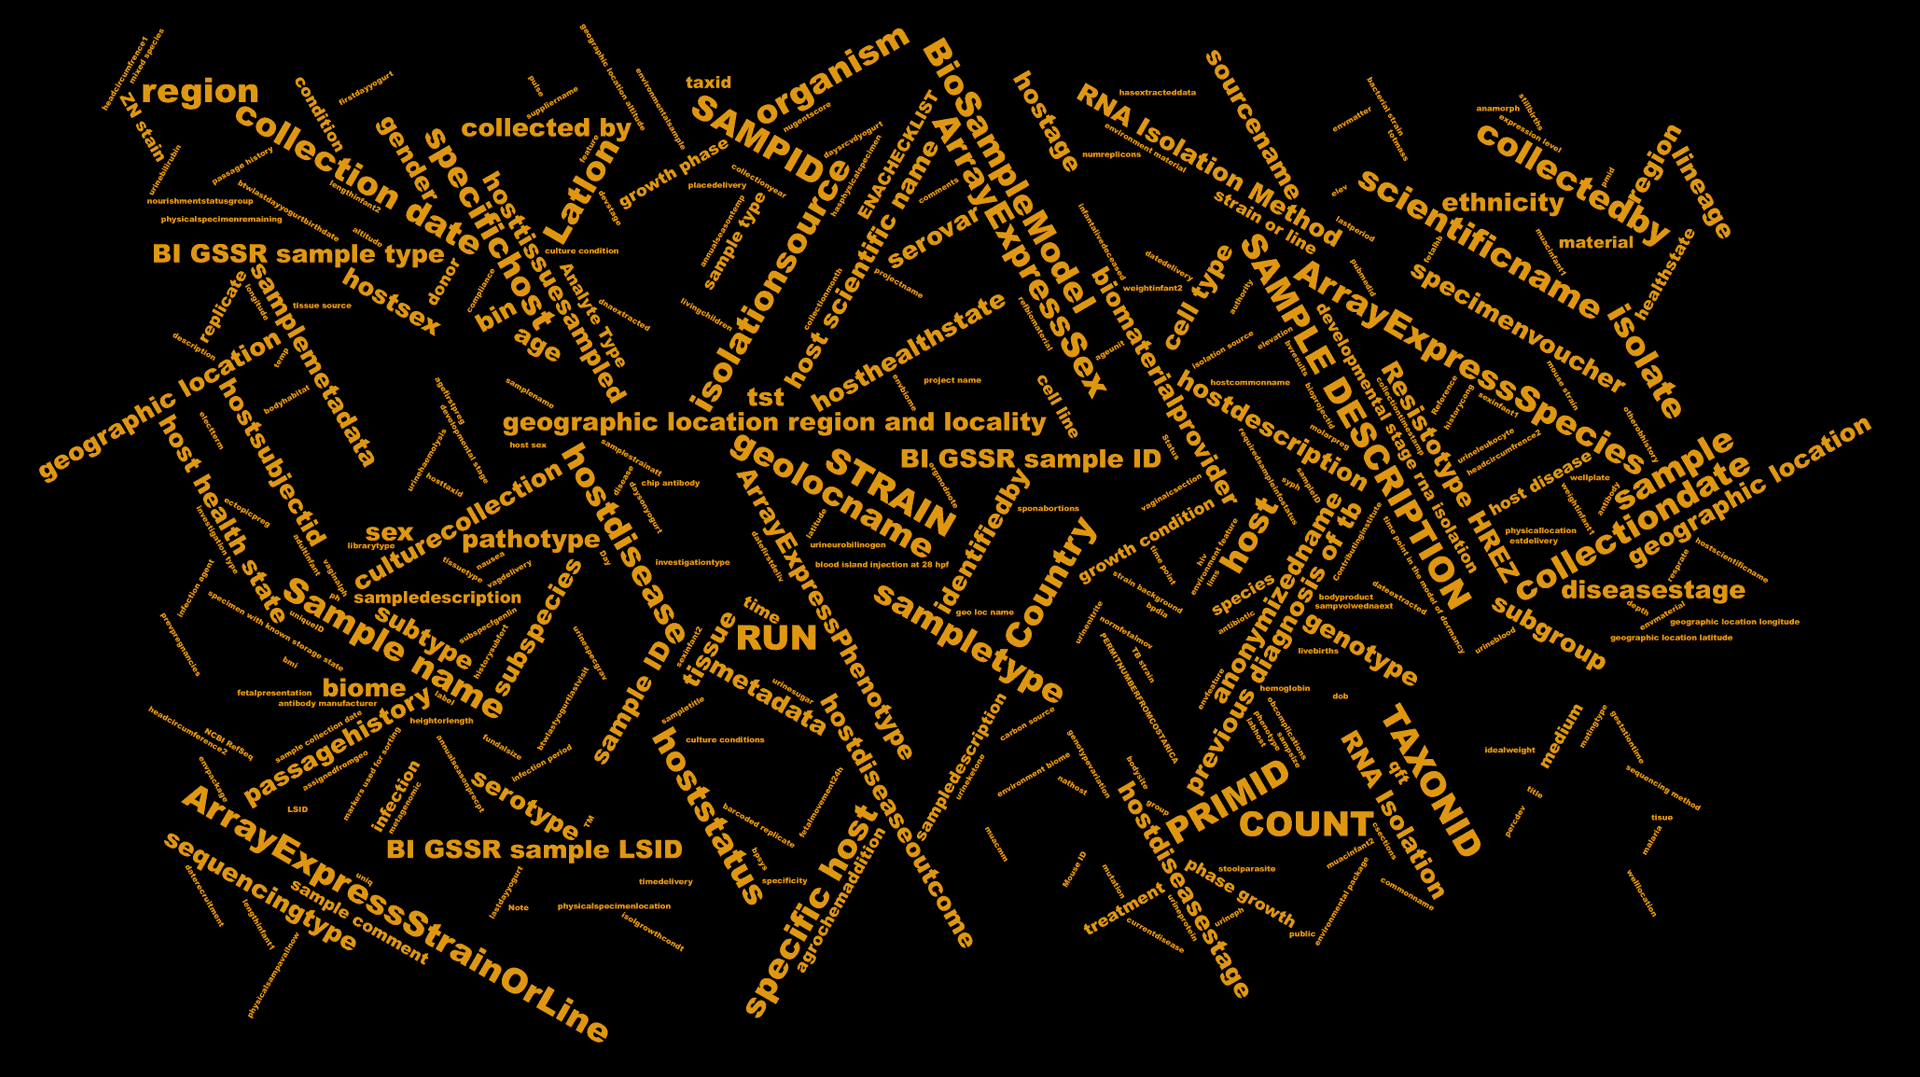
28,000 tuberculosis (TB) sample entries were extracted from the NCBI Database in order to better understand the wide array of descriptors entered at the time these samples were uploaded. A custom frequency-based word cloud was created from all 322 descriptors to highlight the difficulty in…
Electromagnetic Plotter, October 18, 2016
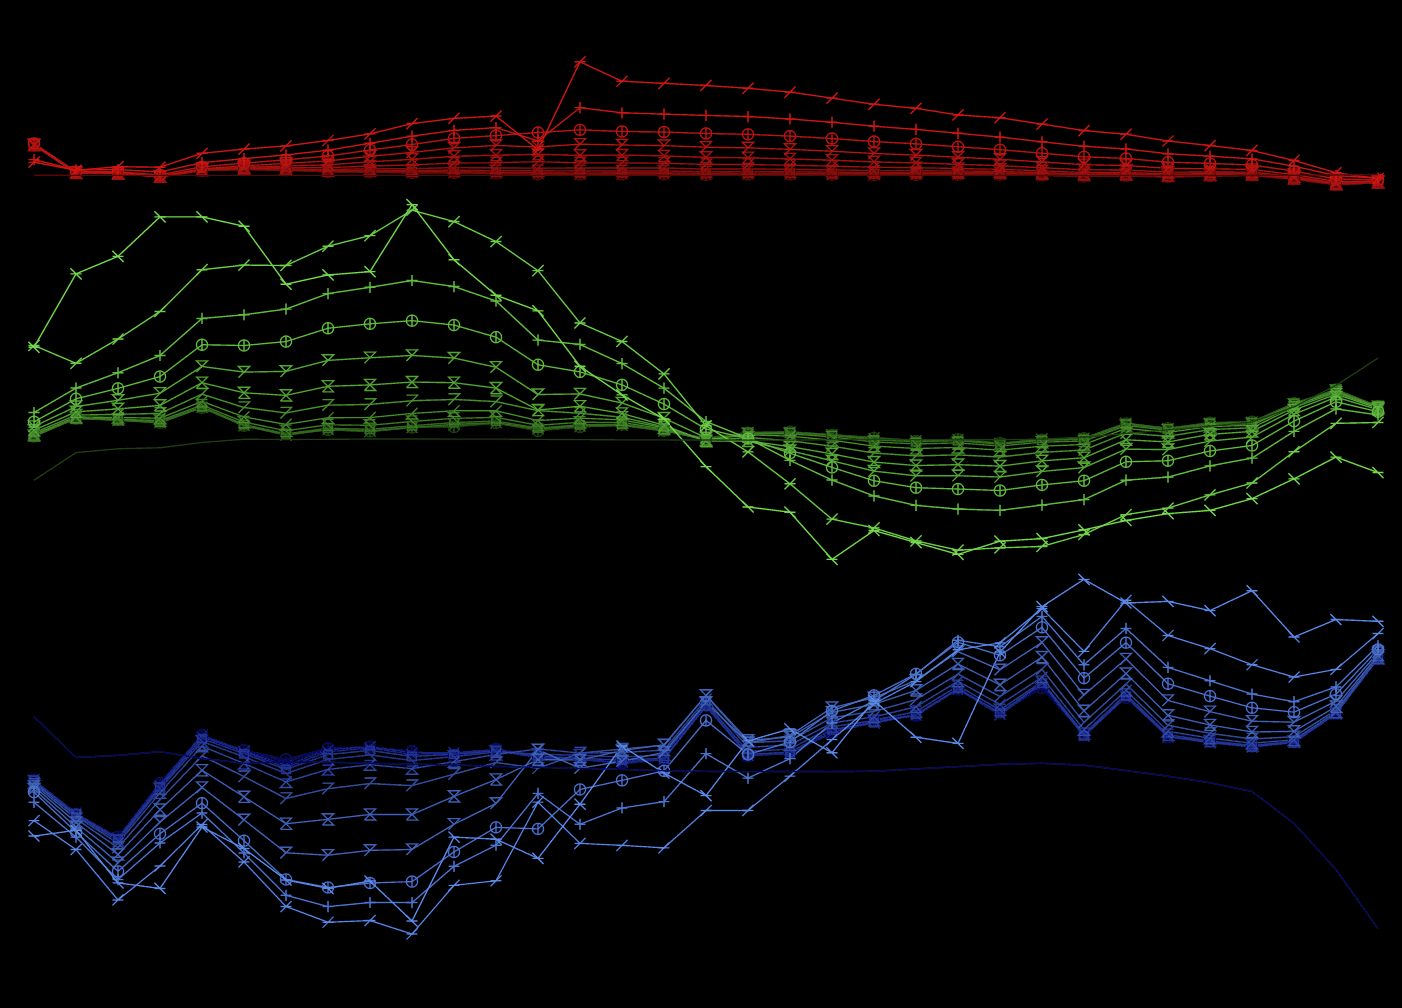
This is a web application that plots electromagnetic (EM) responses from imported files. Referred to simply as "plotter", it is now used as a consulting tool and by clients to plot time domain UTEM data in a web browser. Plotter needed to be capable of plotting downhole and surface data, and orient…