CSUCH - Data Visualizer
March 22, 2019
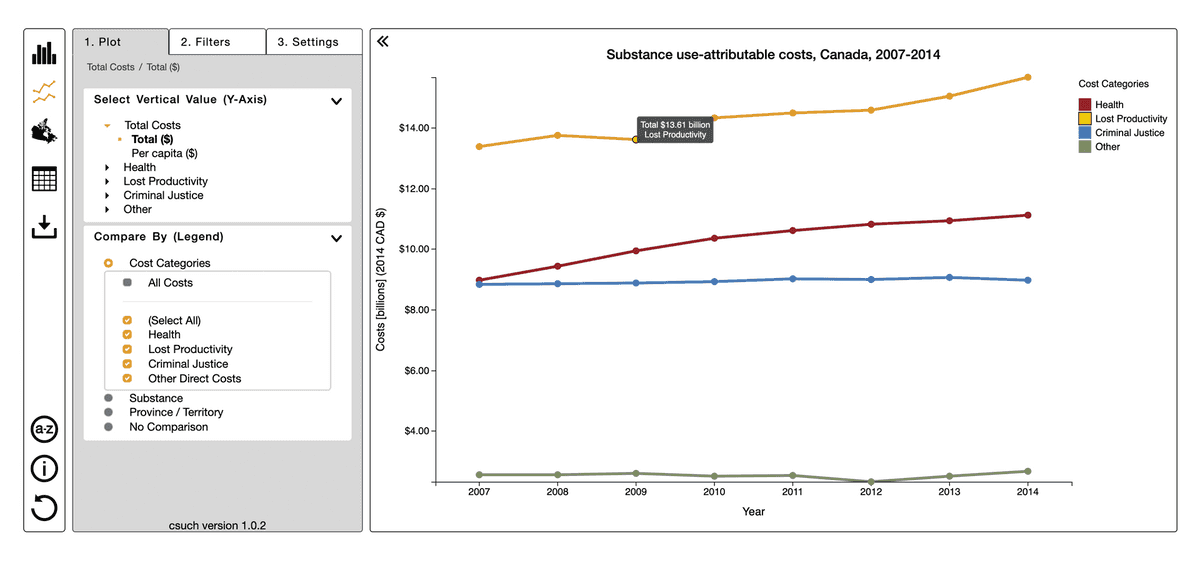
Screenshot of the CSUCH tool's user interface with tooltips
This data visualization tool displays the costs and harms of substance use in Canada, and offers options to filter and compare the data to better explore and understand trends and changes in how Canada spends its resources on substance use and addiction.
This data is provided by Canadian Substance Use Costs and Harms (CSUCH), a collaboration between the Canadian Centre on Substance Use and Addiction (CCSA) in Ottawa, Ontario and Canadian Institute for Substance Use Research (CISUR) in Victoria, British Columbia. The CSUCH visualization tool queries a MySQL database to plot data over using available filters and categories. The design goal for this tool was to provide structure and clarity for first time users while being flexible enough for return users to effectively navigate what they are looking for in the data.
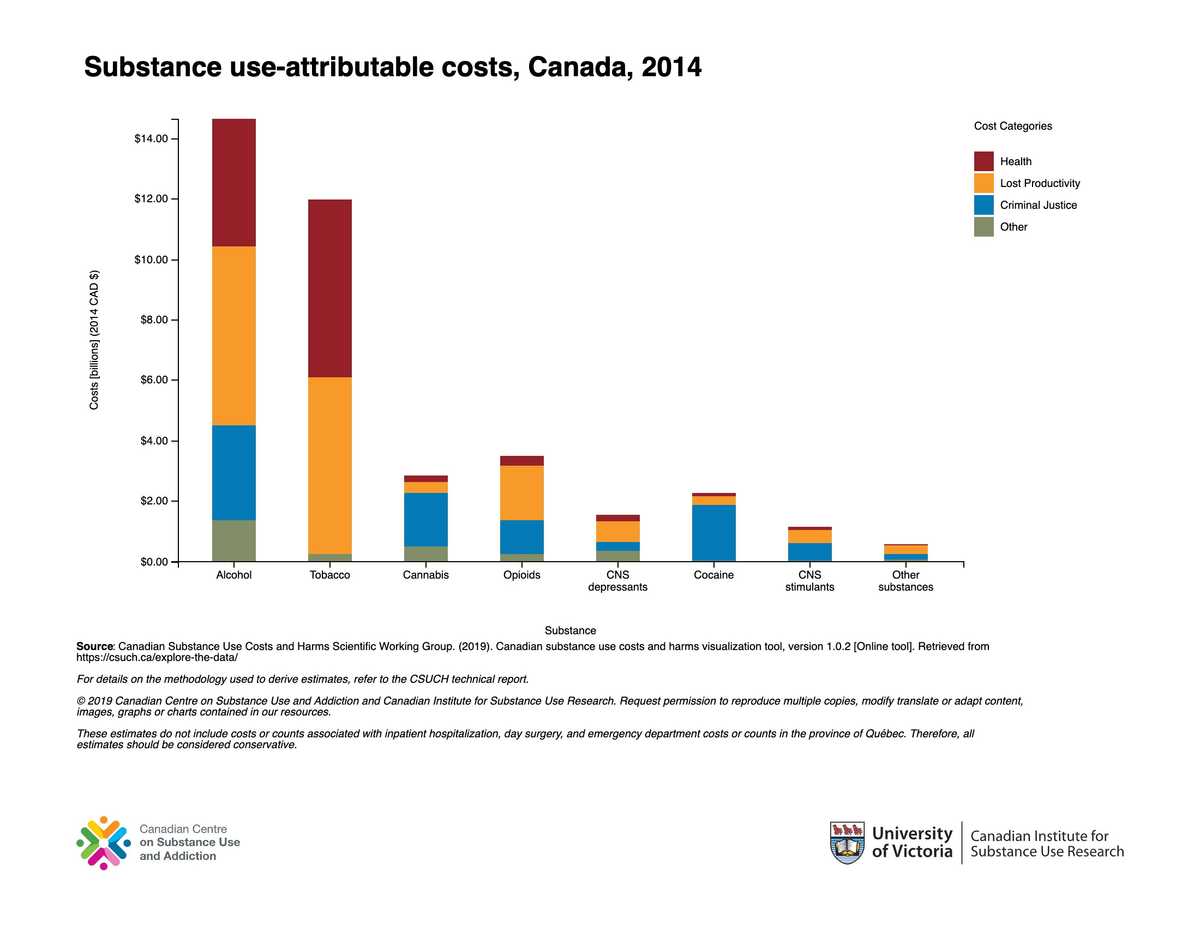
The tool can display bar charts, time series plots, a map, a table, and export .pdf, .png, .jpg, .svg and .csv file formats and exists in both english and french.
An exported file from the CSUCH visualization tool. The tool displays bar charts, stacked bar charts, time series and multiseries plots, a map, a table, and export to a variety of file formats.
The user interface is broken up into a suggested series of steps to better organize the user experience. After one of five categories are selected for the Y-axis, the X-axis and an optional "compare by" list is updated depending on the data available. Once plotted, the user can filter the selected data using the filter tab, and can go back and update at any time while keeping the selected filters, if available.
Object constancy was an important feature of this tool, and changes in the data are animated with d3.js such that toggling between related settings updates the plot without resetting.