A music visualizer is anything that presents audio visually. By analyzing the timing and frequency of incoming audio, algorithms can be built to respond to music in all kinds of interesting ways.
January, Who is Bruce Kauffman?, March 01, 2019
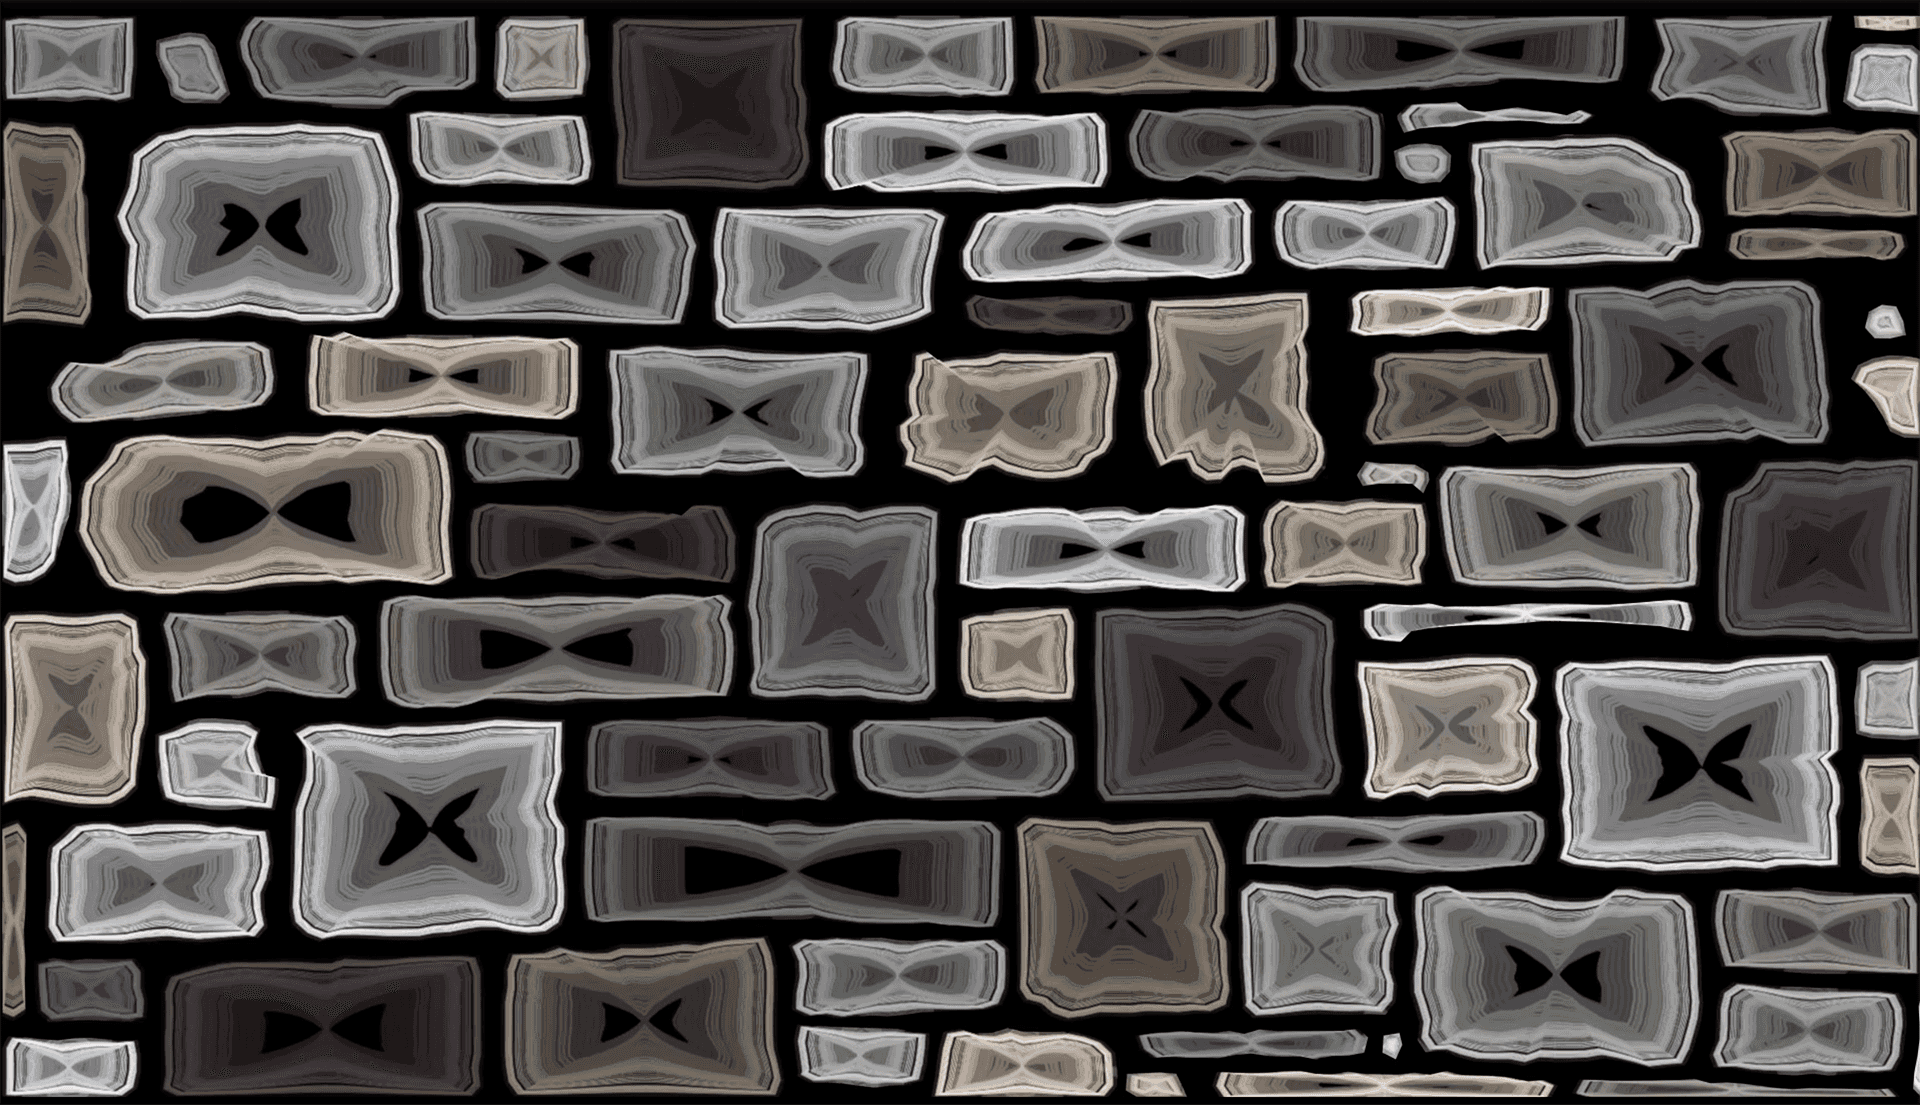
Based on the poem January by Sadiqa Khan, January is a visual exploration of a fox's imagined journey through the Davis Tannery Lands, a 37 acre brownfield site on the shore of the Rideau River in Kingston, Ontario. The poem was read by Sadiqa Khan and recorded by Matt Rogalsky. The music featured…
Visitations and Revisitations, August 14, 2018
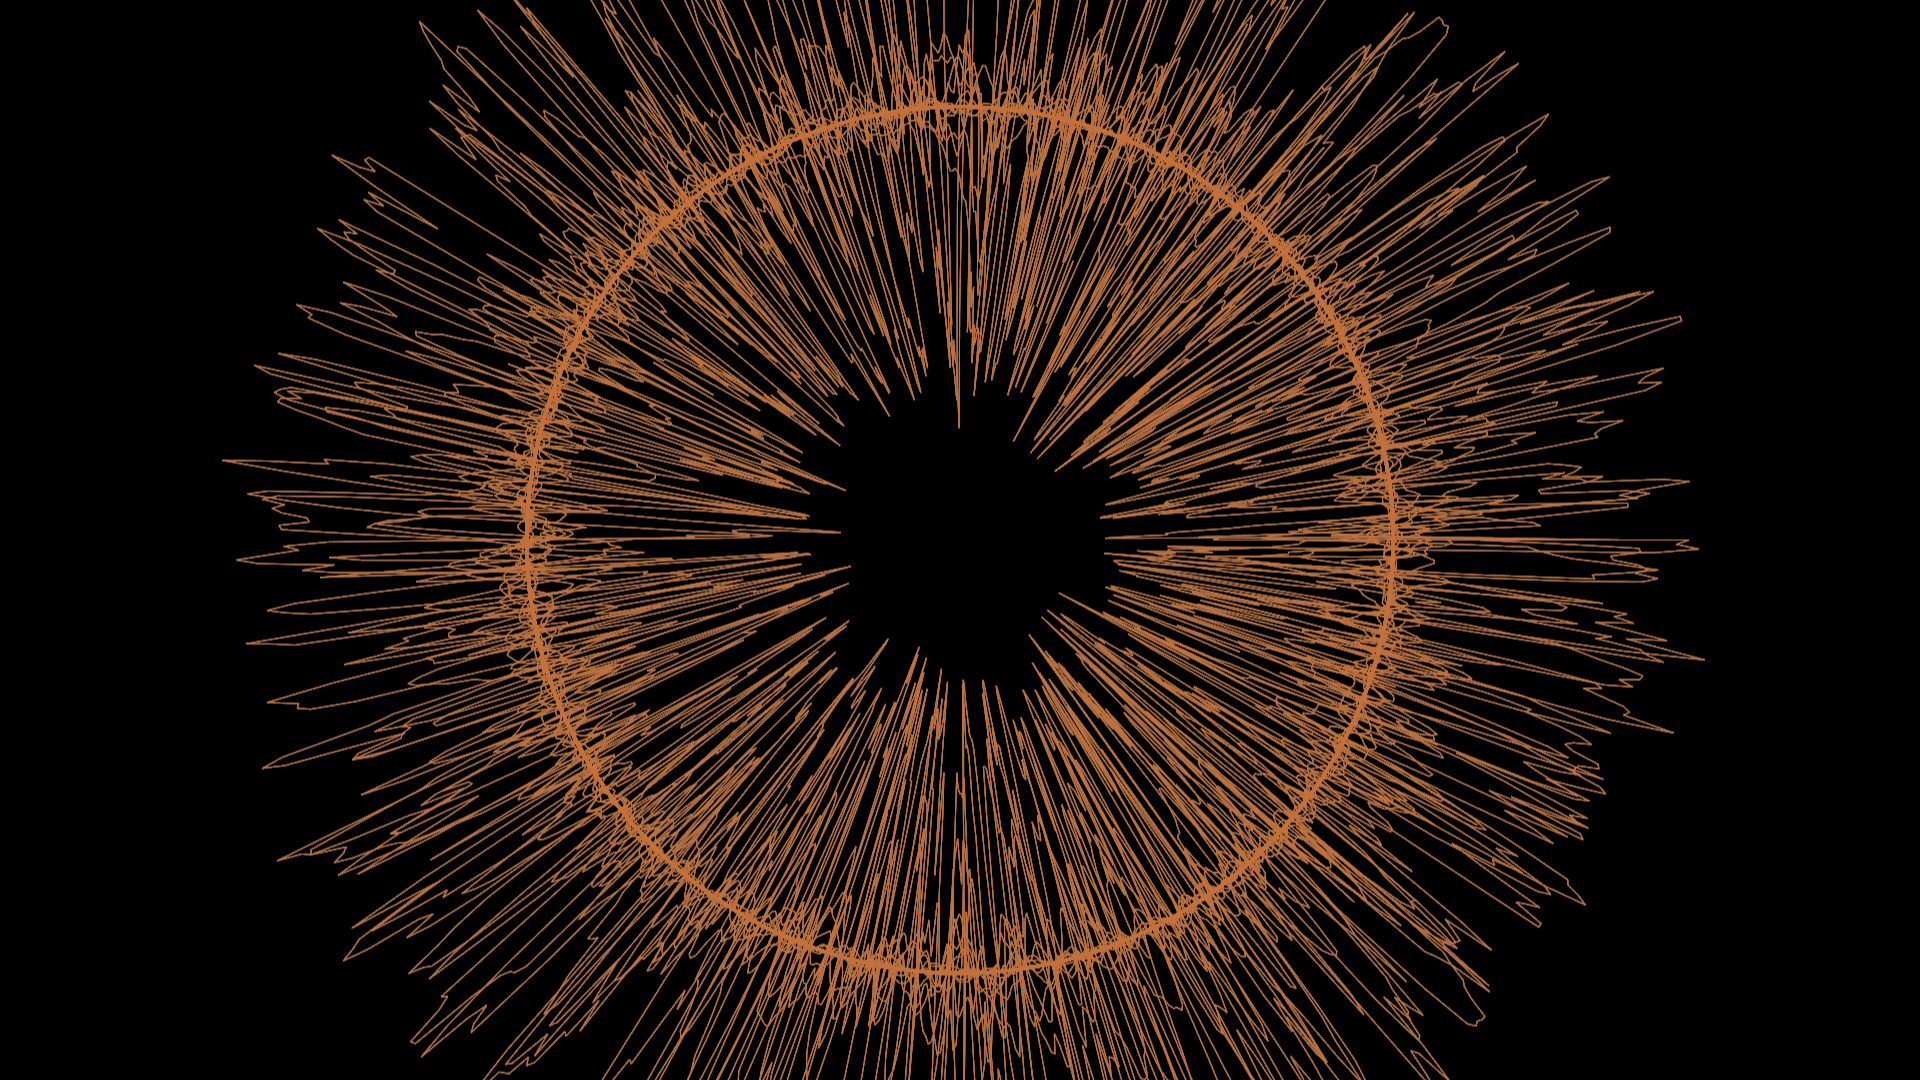
Visitations and Revisitations is a series of four pieces by Matt Rogalsky, that was performed live at the Isabel Bader Centre for the Performing Arts. Visuals for each performance featured a number of new algorithms including a circular representation of audio waveforms as well as several flowers…
Solstice Festival, June 24, 2018
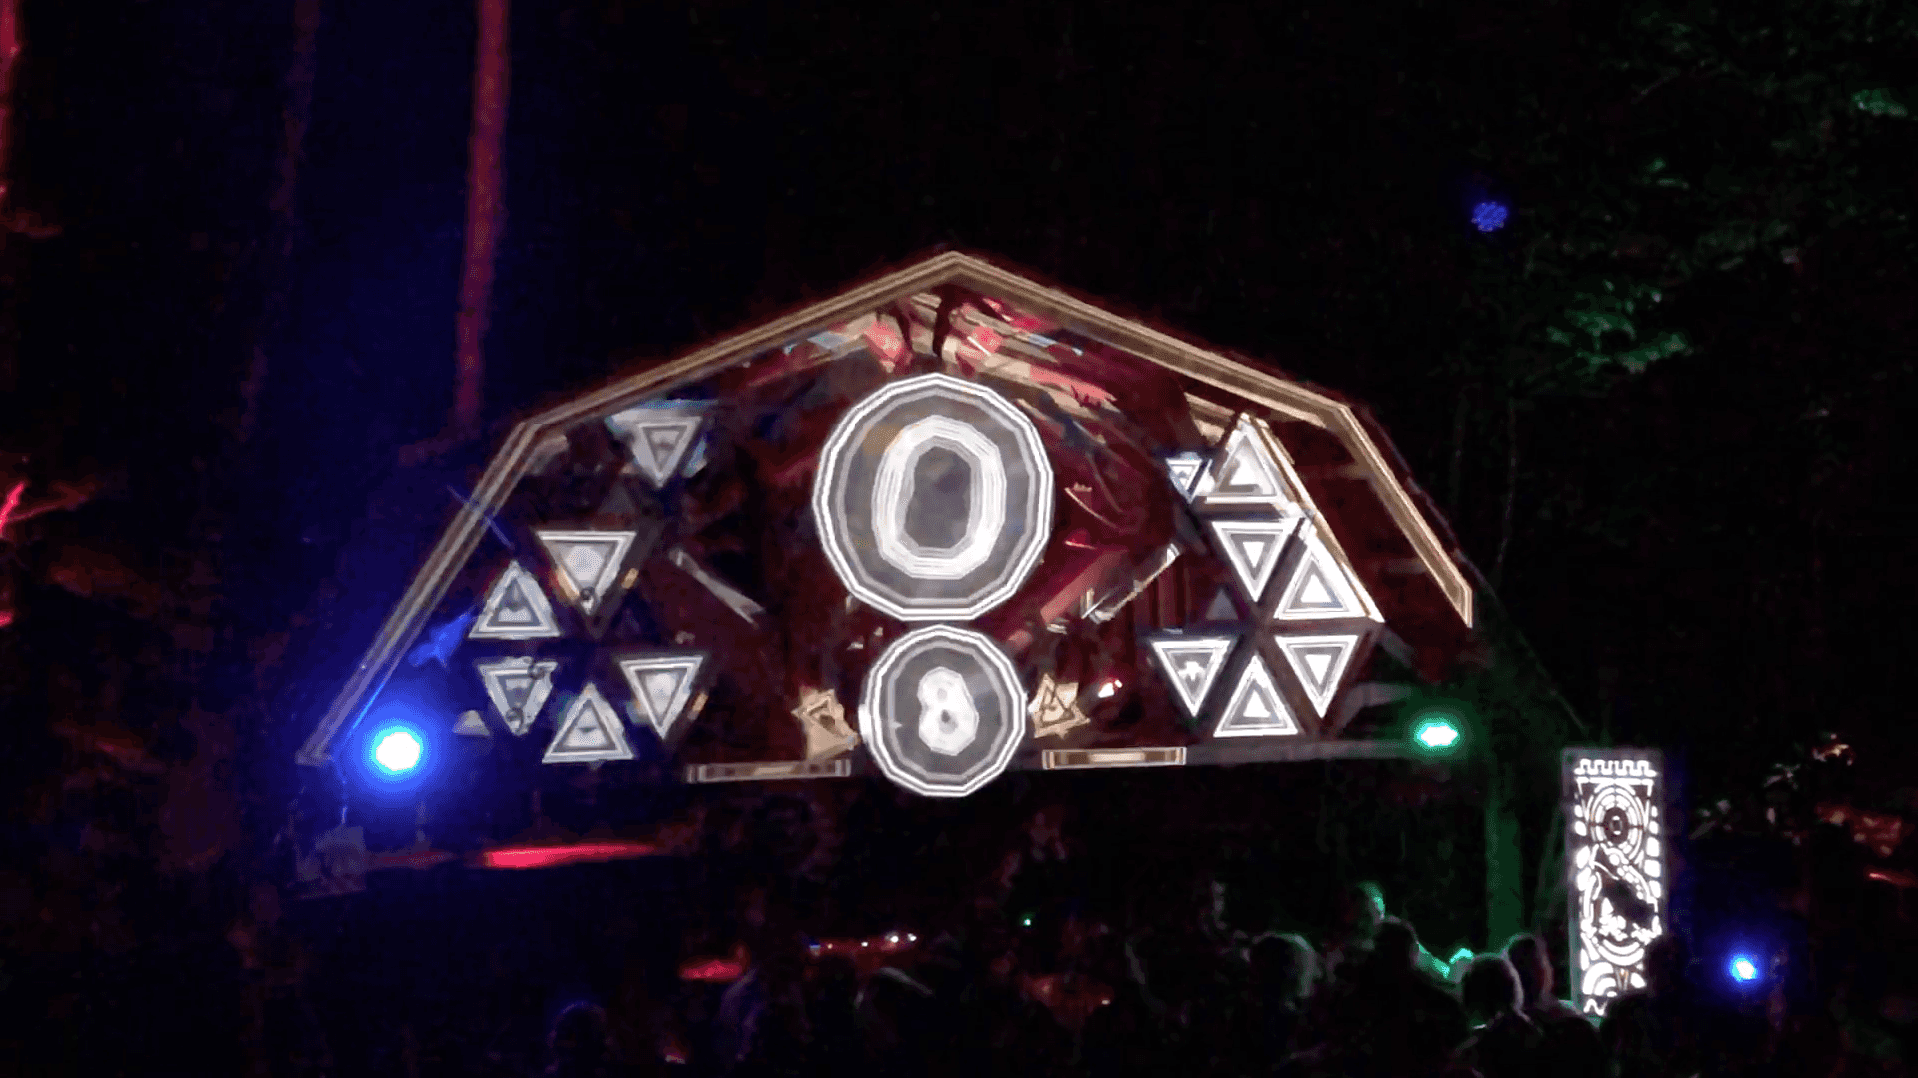
Writing custom web-based projection mapping and music visualization software is a pastime of mine. At the Summer Solstice Festival north of Toronto, the software made an all night appearance in June 2017, and then again in June 2018. As Dan Brown, one of the festival organizers for the Root Stage…
Electric Circuits (2017), April 07, 2017
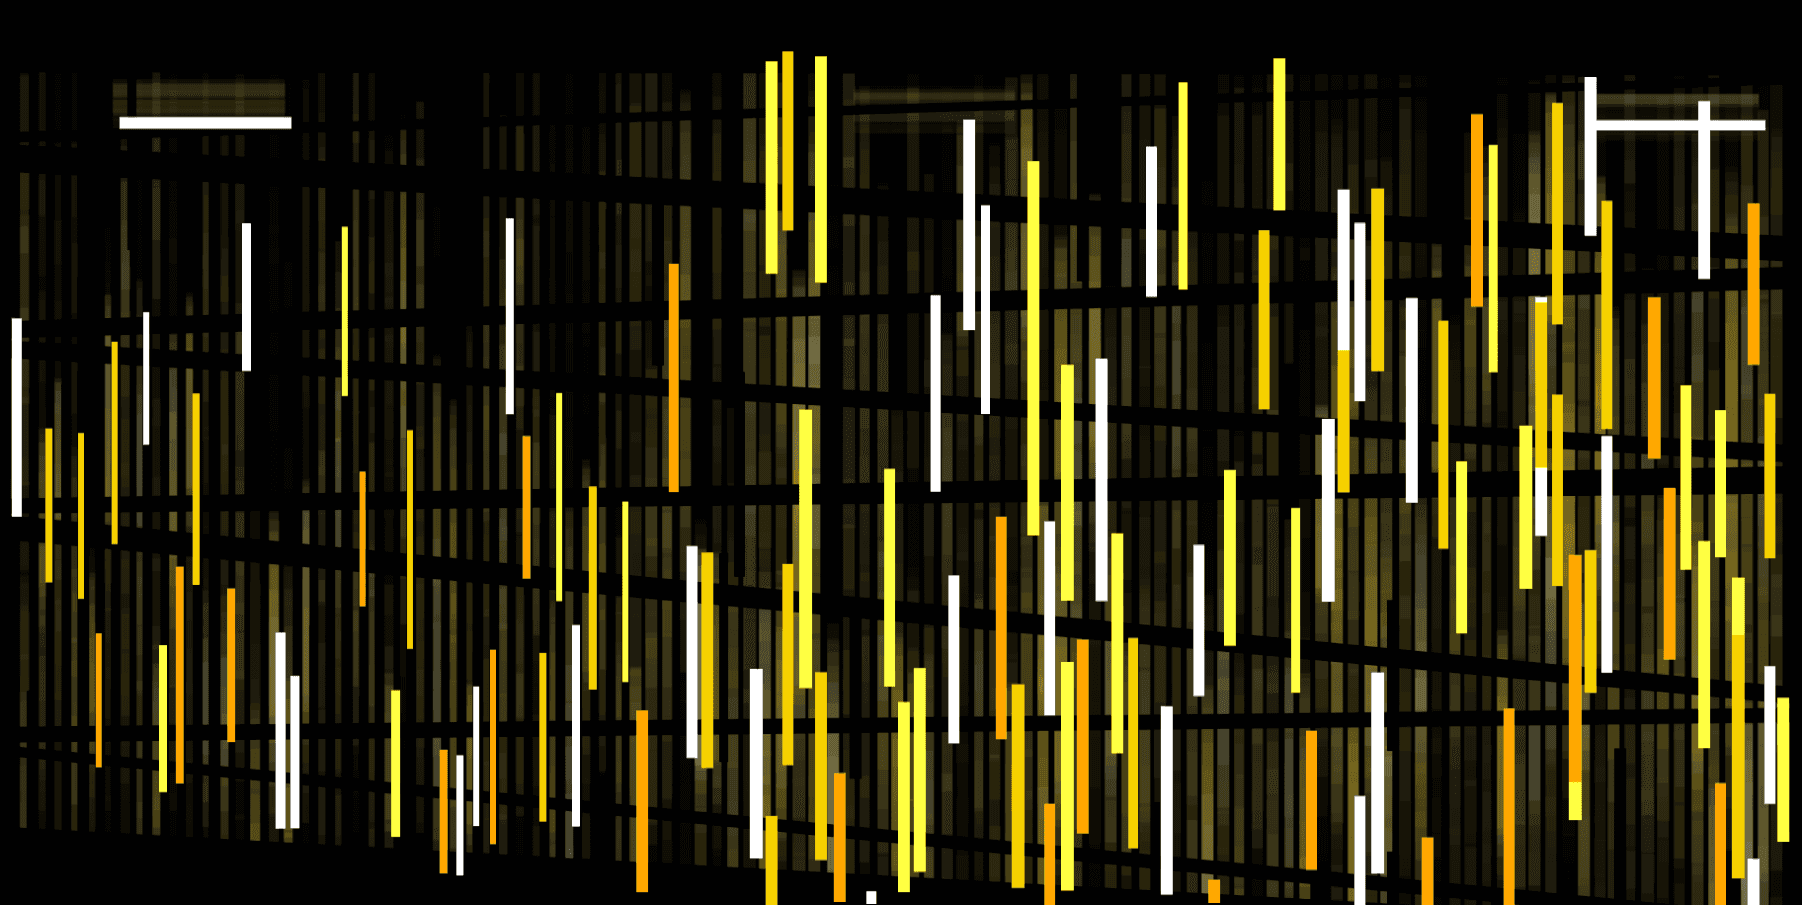
Writing custom web-based projection mapping and music visualization software is a pasttime of mine. This particular projection mapping and audio visualization project had 138 vertcial slats of wood, to be mapped at the Rehearsal Hall of the Isabel Bader Centre of Performing Arts in Kingston, Ontario…
Let us go then, you and I..., November 03, 2015
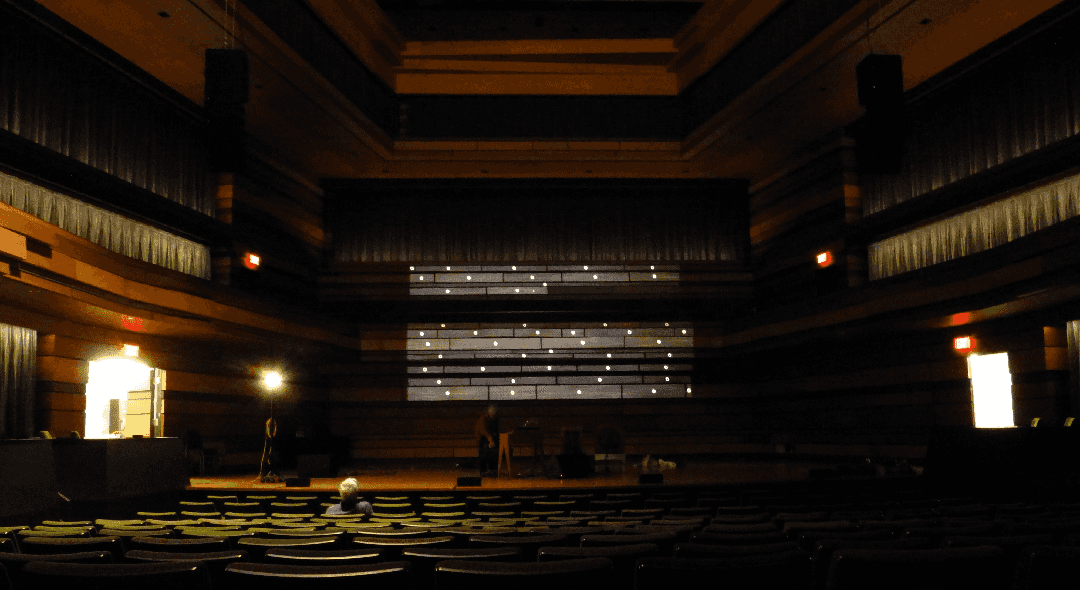
As part of Tone Deaf 14, a projection show was performed by Decomposing Pianos at the Isabel Bader Centre of Performing Arts in Kingston, Ontario. For this performance, custom code was developed to map the wooden panels behind the main stage. This software went on to become a versatile tool for web…
String Theory, 29/12/11, October 24, 2014
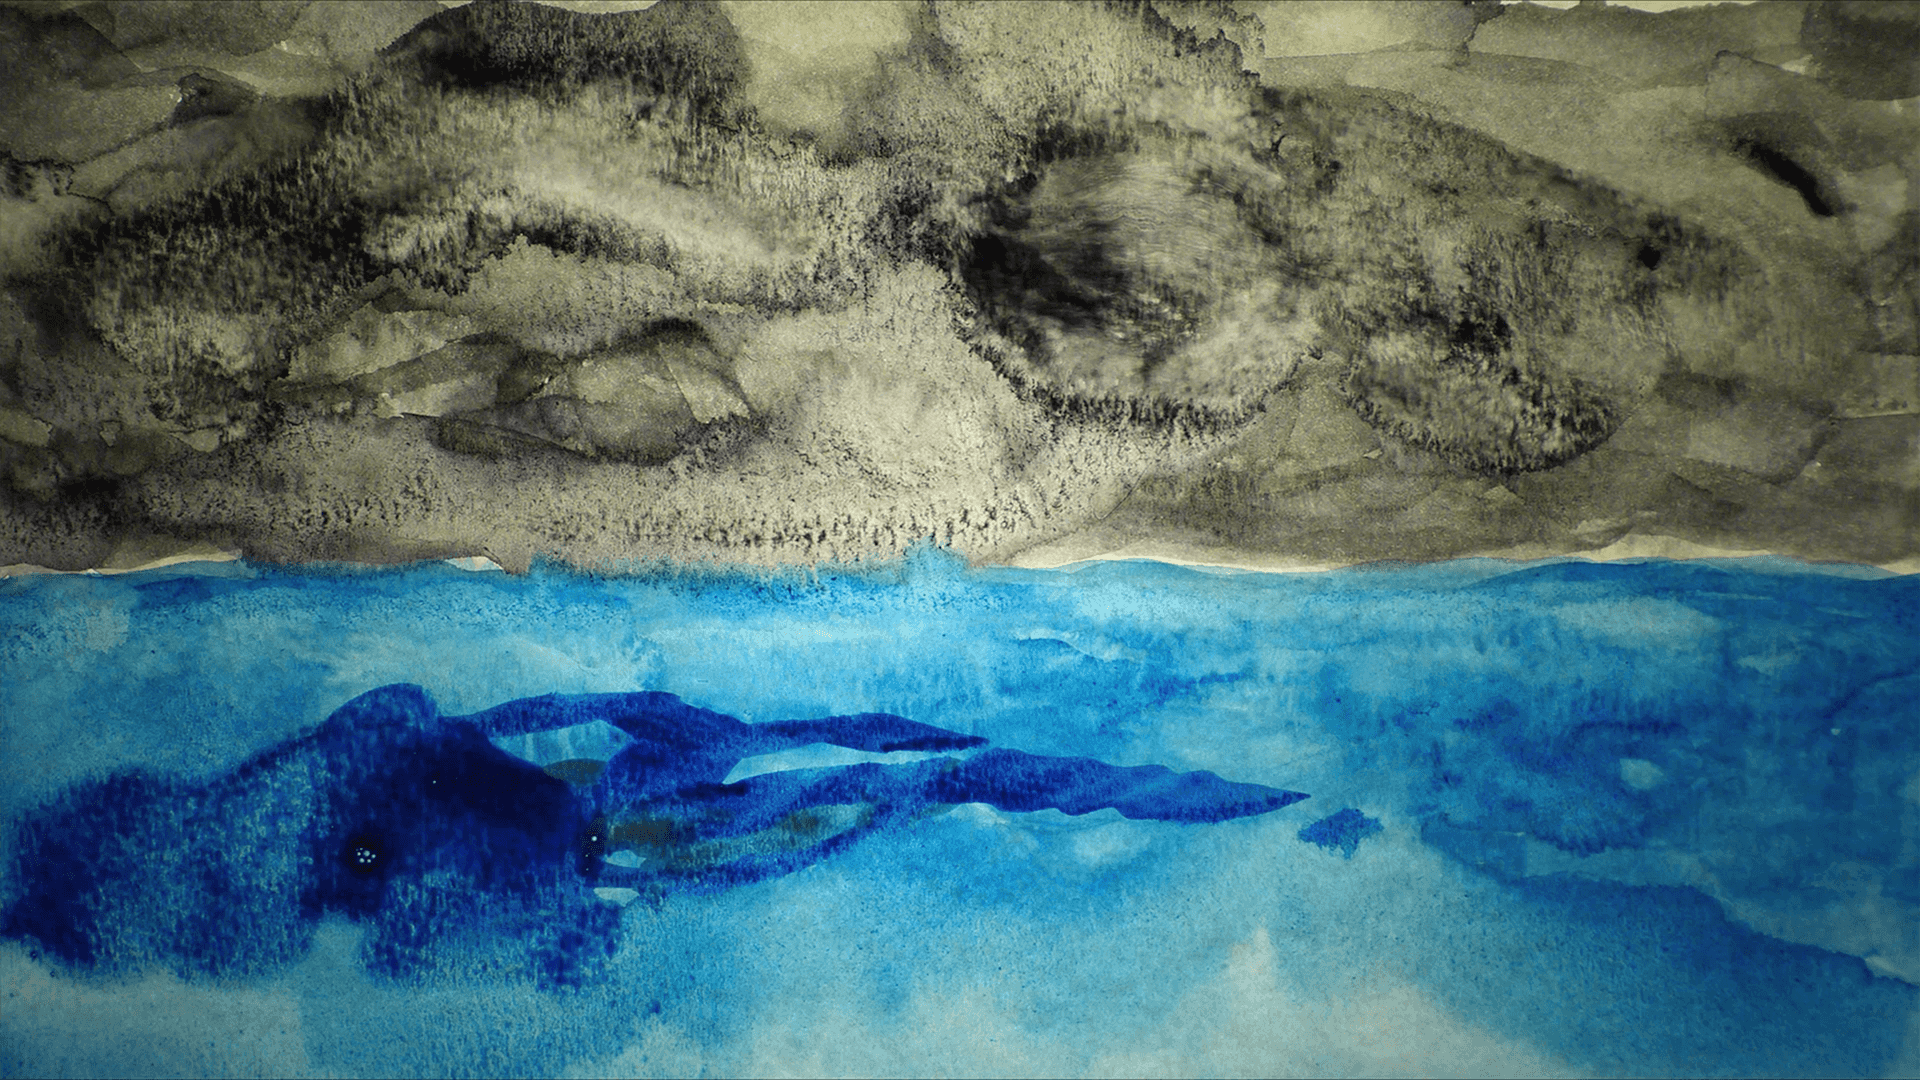
Set to the track 29/12/11 from Danielle Lennon's String Theory, this video features the changing seasons looking west along Lake Ontario. To build the video, over 4000 water colour sketches were sequentially added to a single sheet of cold press paper. Some of the challenges encountered in making…
Cognitive Dissonance - 3D radio, August 11, 2014
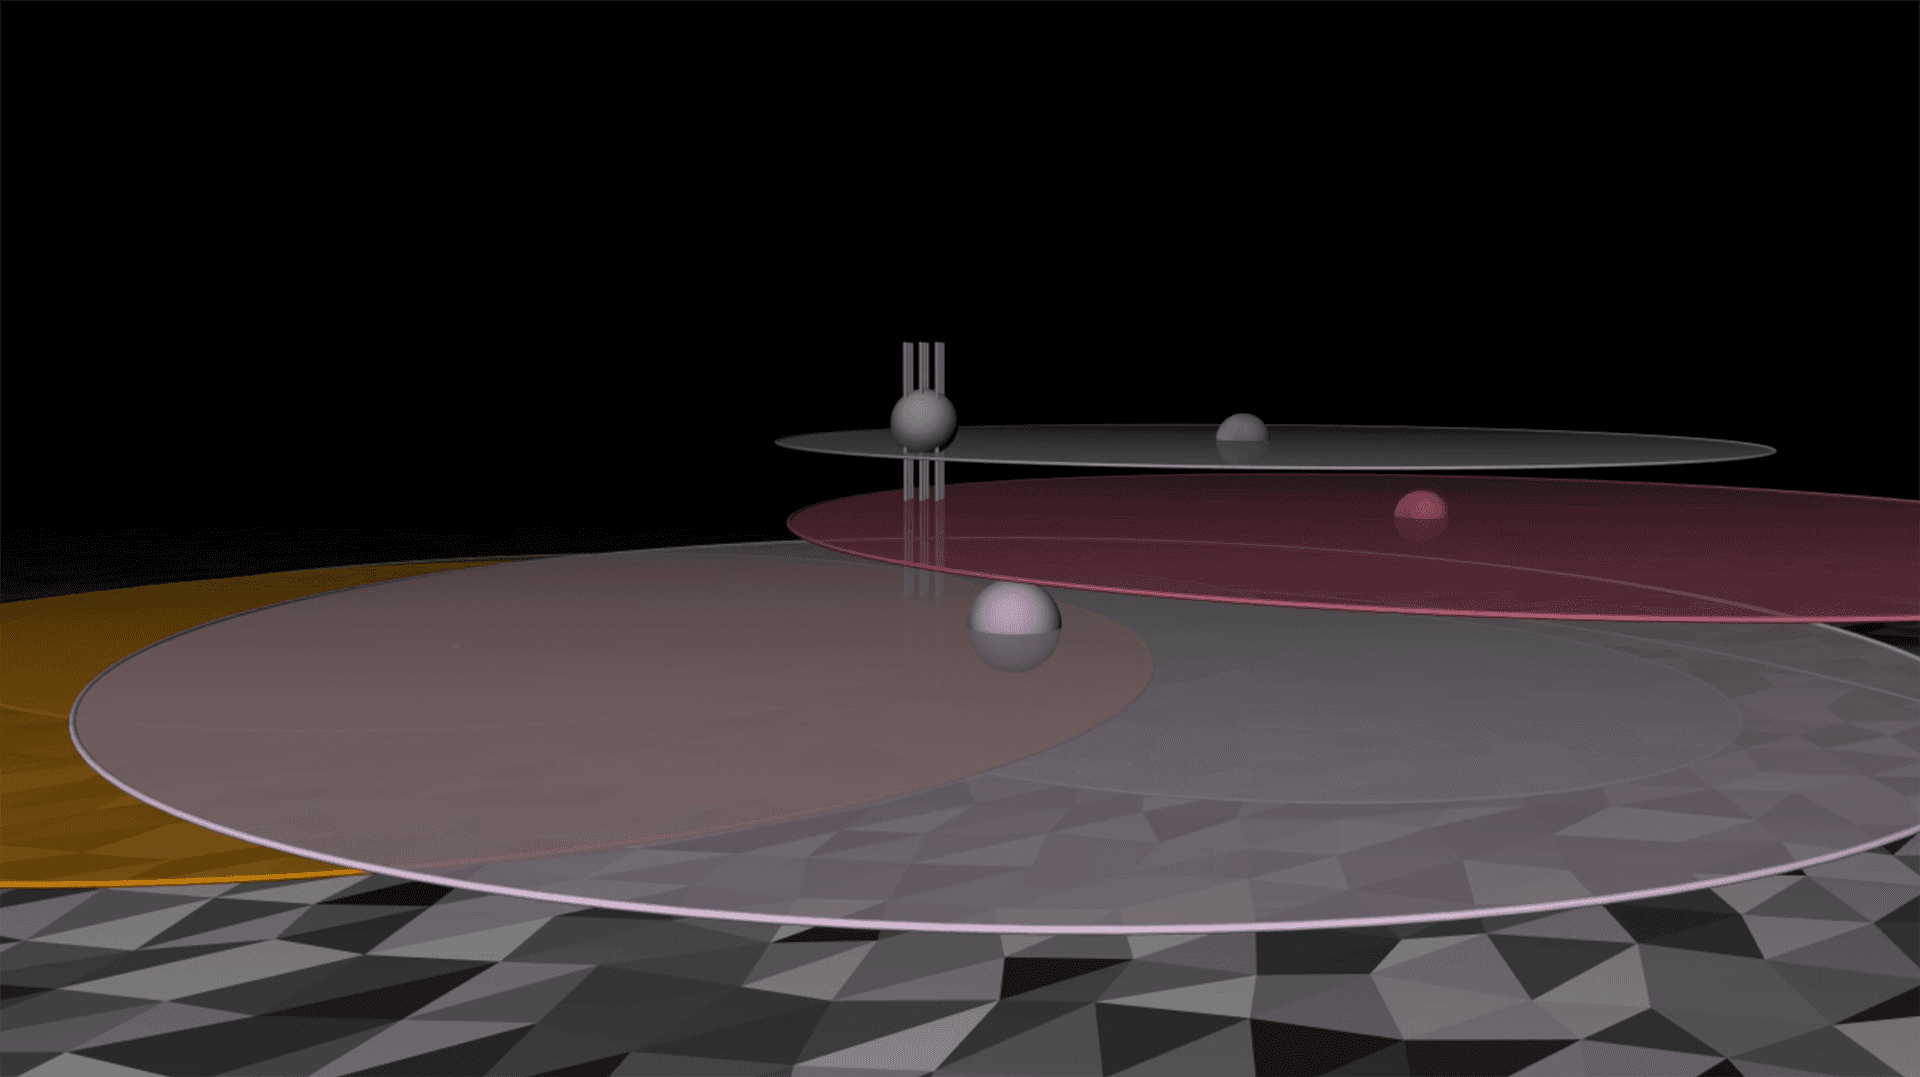
This is a live screening that took place at the Screening Room in Kingston, Ontario. It features visual 3D radio clips on the meaning of music, as collected by my friend and colleague Chris Trimmer. 3D space is navigated using three.js pointer lock controls. Audio is emitted using webAudio panner…
HTML5 Visualizer with MIDI Input, August 01, 2014
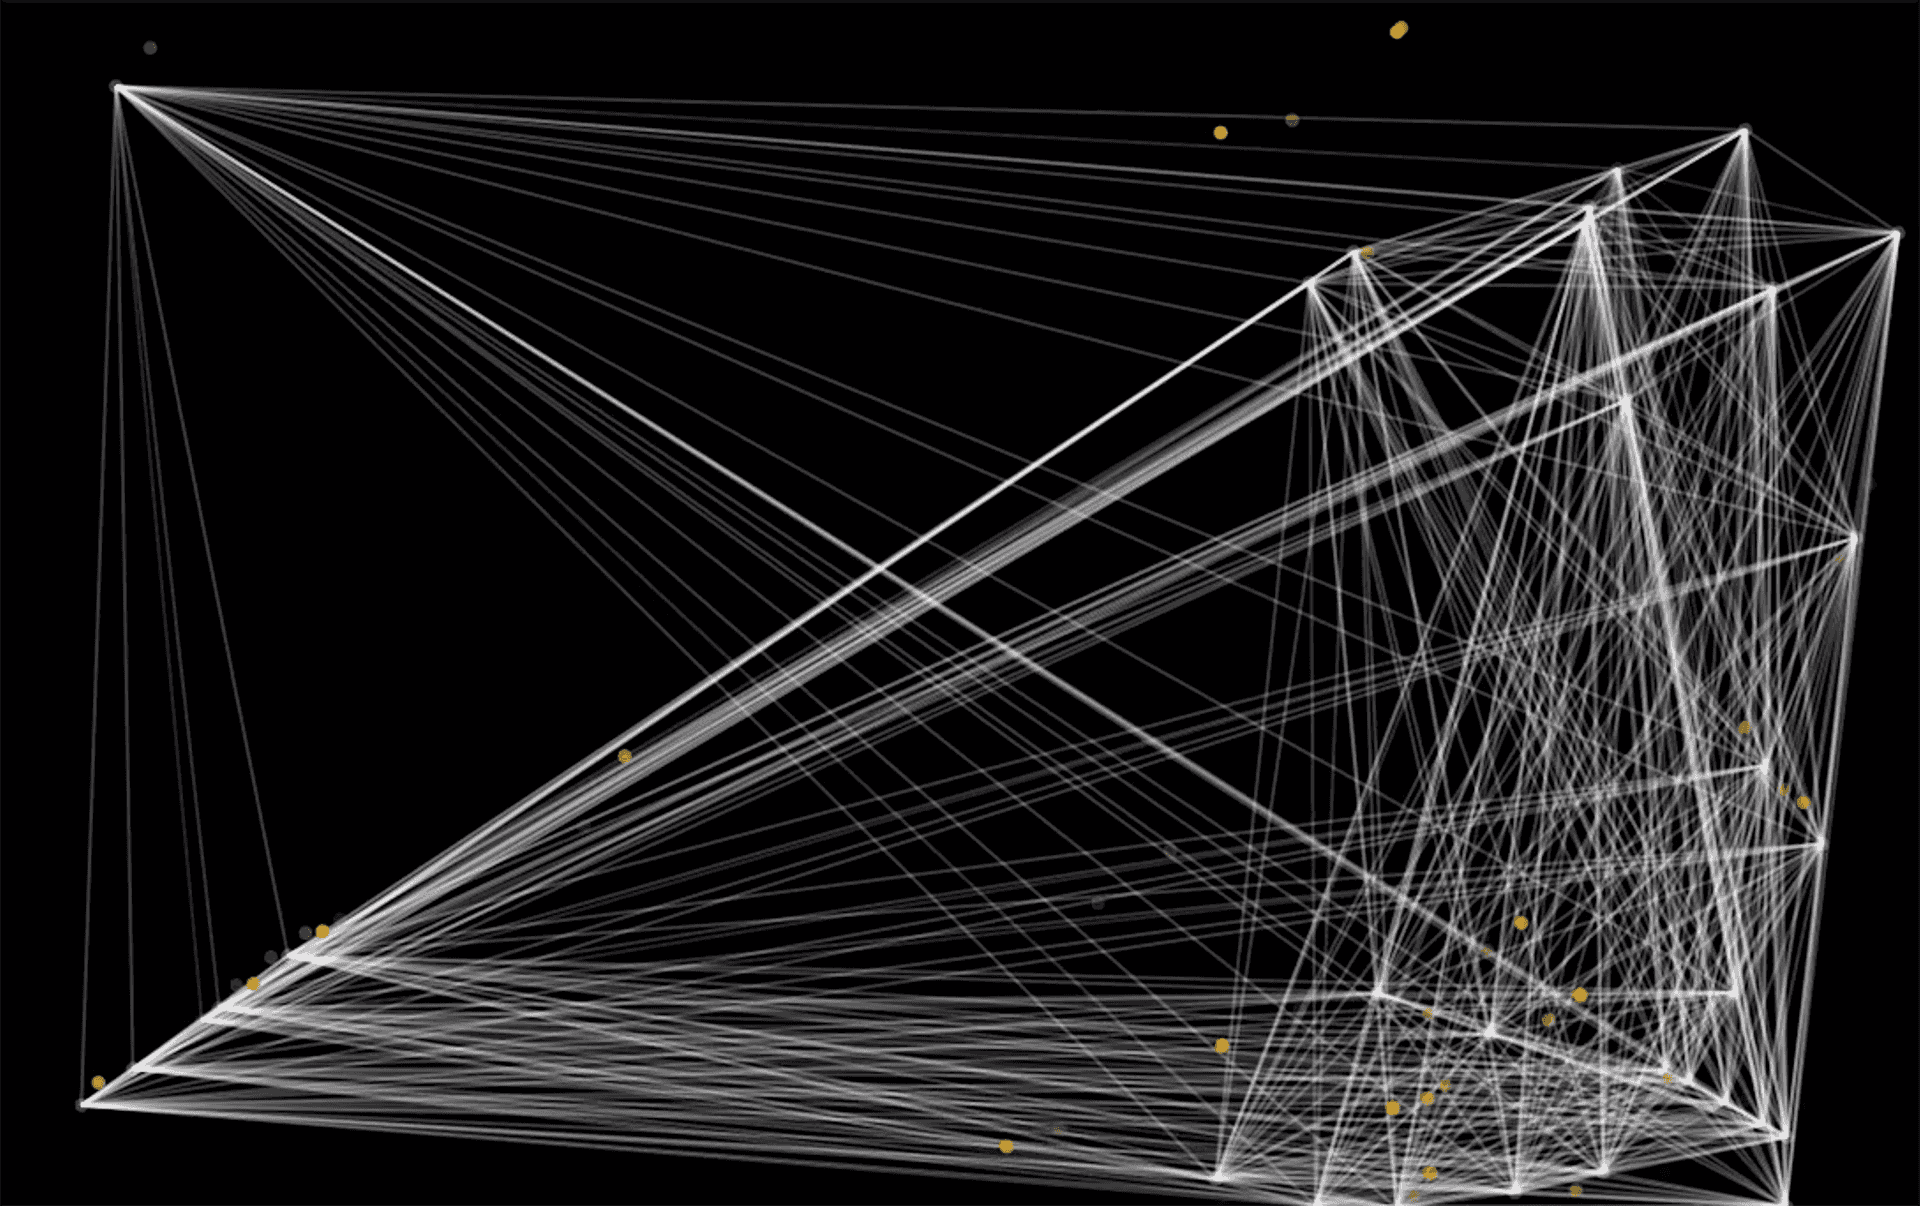
This visualizer was originally intended to present chords and tones for the Decomposing Pianos project 88 Years. An interactive piano keyboard was made using HTML5 canvas such that sounds could be played and portraits displayed. This evolved into an experimentation phase in javascript, where several…