Between the Sand - Phase 3 - Online Exhibition
December 05, 2020
The third and final phase of Between the Sand is an interactive web application that premiered in Art the Science's Polyfield Gallery on December 5th, 2020 to coincide with World Soil Day. To create this, the web application from Phase 2 was expanded and optimized. An Explore tab was added where one can change the flow direction, toggle the contamination or update the display. A lava mode automatically changes the settings over time for passive viewing.
Flow direction can be changed along with other settings such as pressure, diffusion, and a lava lamp mode for passive viewing.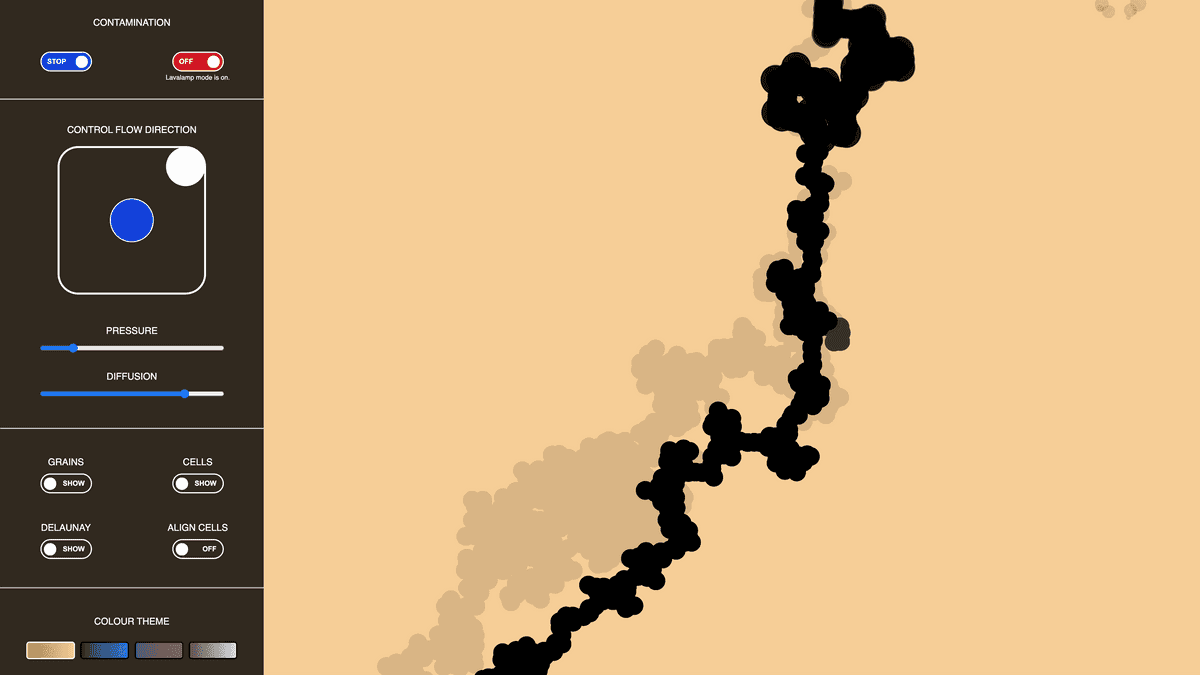
Drawing
There are 4489 sand grains and 62,500 cells in this work, and drawing them is resource intensive. To help with drawing, several canvas layers are used to display grains, cells, and contamination individually. A webGL layer runs a shader program in one of the layers to preserve each contamination after they have finished expanding.
The different drawing layers in Between the Sand include layers for contamination, sand grains, spaces and sprite sheets.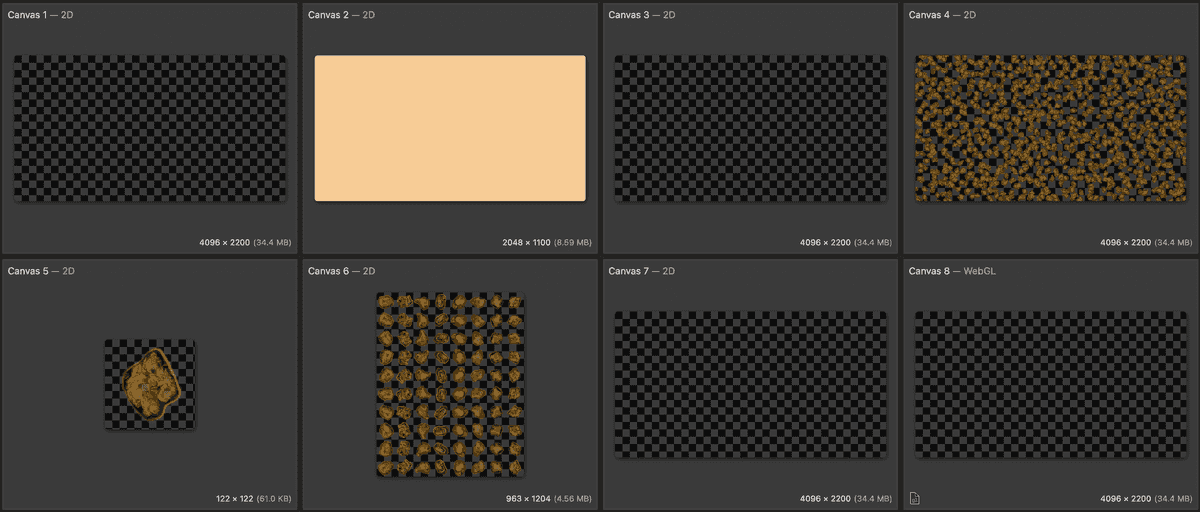
A sprite sheet is used to speed up the drawing process. Using the sprite sheet, the program draws eight grains of sand, each rotated ten times, for a total of 80 grains. These are distributed across the field of view, allowing for the grains to be drawn on demand without slowing down the application.
A sprite sheet is used to speed up the drawing process by placing predrawn grains across the field of view.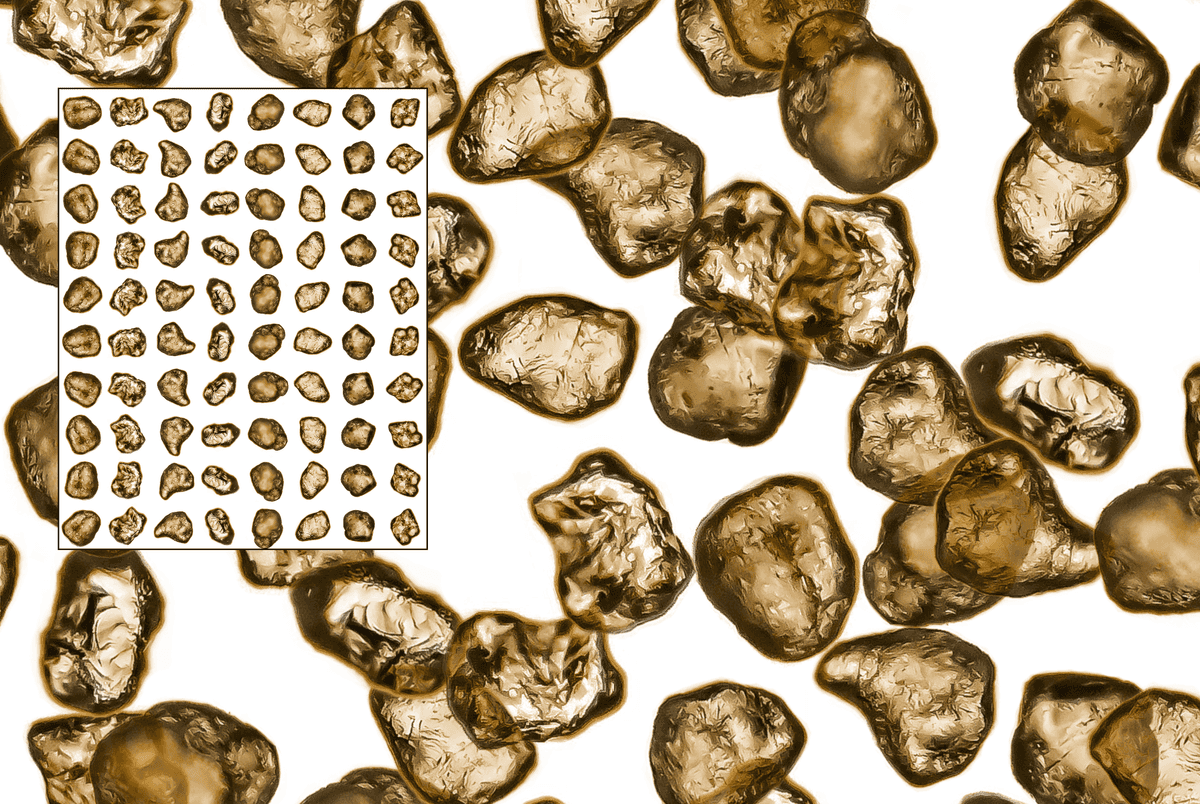
Each grain is coloured before being drawn to the sprite sheet and placed on a background gradient of similar colour. Two of the colours are blue and purple, to simulate the effect of an experiment with dye, as seen in Phase 1 of the residency.
Sand grains can be "dyed" with a purple or blue hue.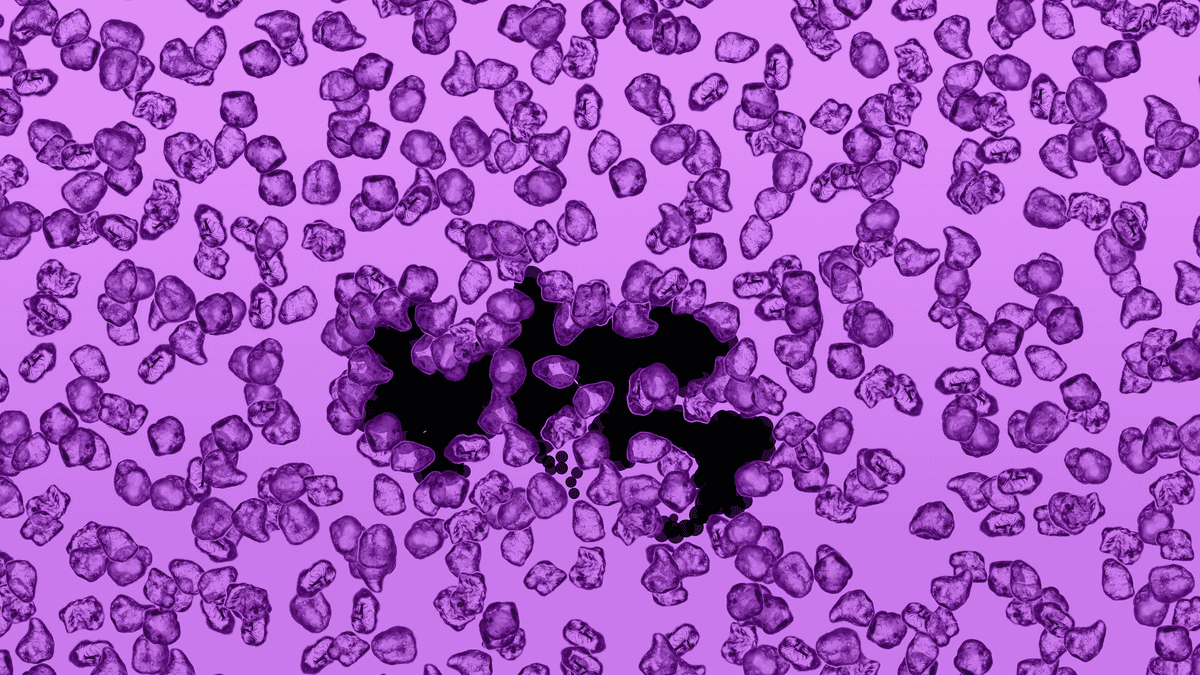
Invasion Percolation
The contamination itself is powered by this Invasion Percolation algorithm, which I ported into Javascript. The algorithm works much like paint by numbers, where available space is broken into cells to determine how the space should be coloured, or invaded. An r-value describes how invadable a cell is depending on its distance to the nearest sand grain, as well as outside forces such as flow or gravity. This r-value is between 0 and 1, where 1 is an open pathway, and 0 is blocked by sand. The cell's r-value is assigned a transparency value for drawing, also between 0 and 1, where 0 is transparent and 1 is opaque. In other words, cells with grains are less likely to be invaded, and are lighter in colour.
Sand grains are positioned in a grid to clearly define the spaces surrounding each grain.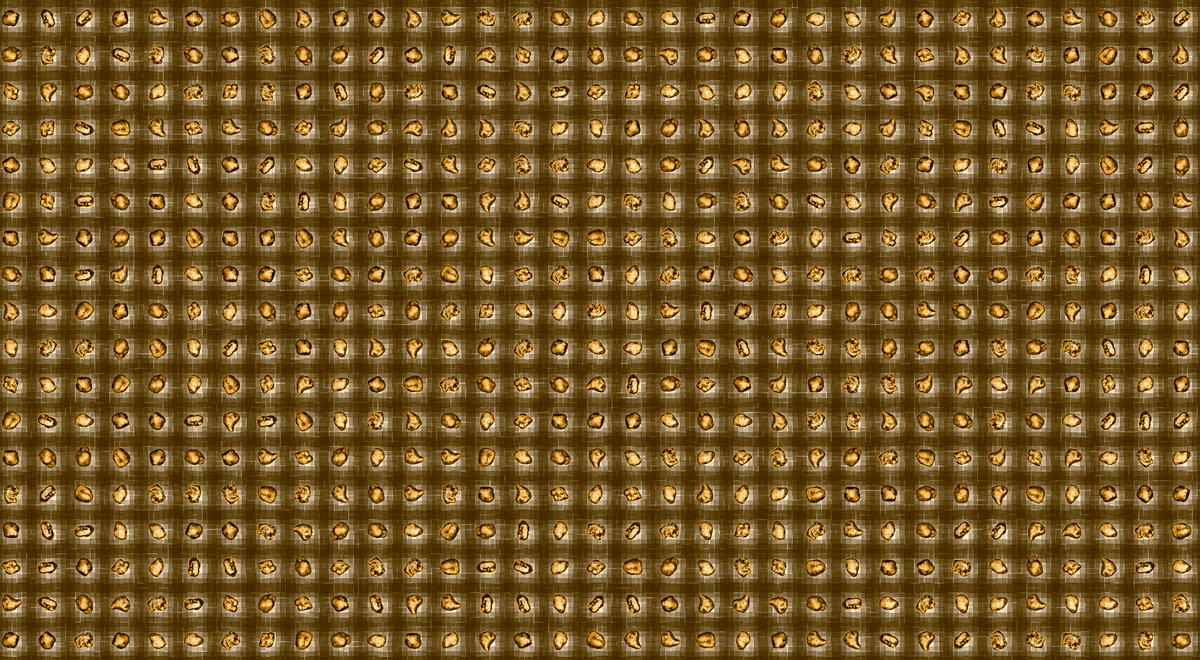
The grains are distributed across the field of view to create an organic looking section of sand. The spaces between the sand form branching paths as they wind their way through the grid, which the invasion percolation algorithm uses to determine flow.
Sparsely positioned sand grains show how the invadability factor or r-value of each cell depends on the distance to the nearest grain of sand.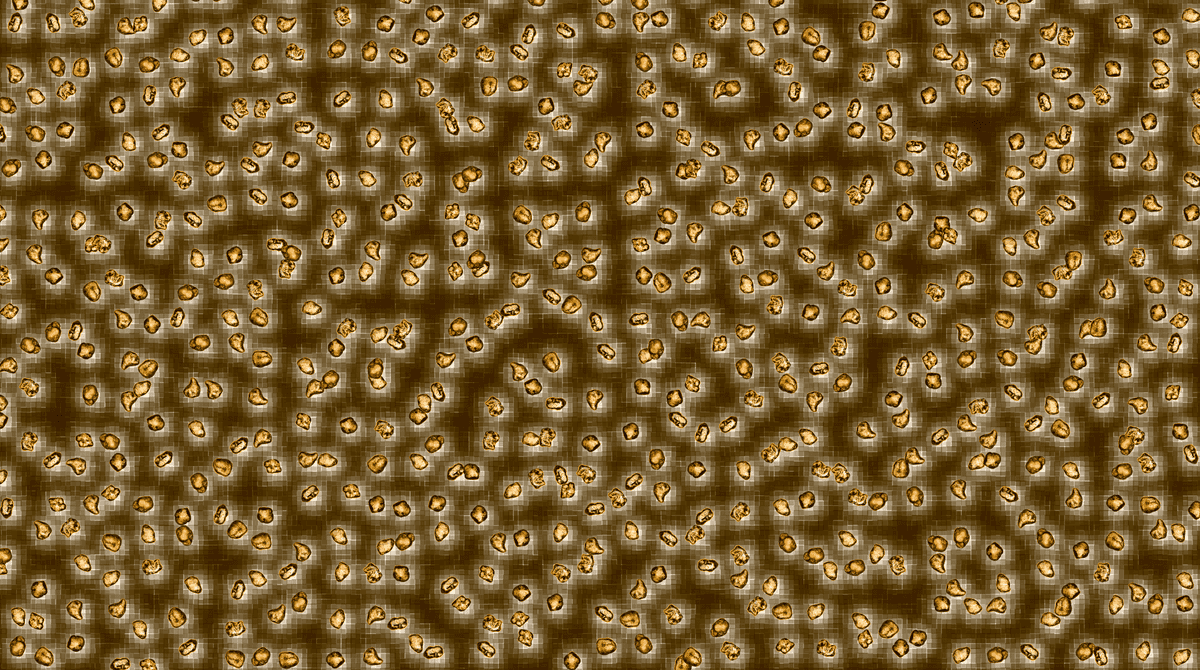
Distance Calculations
In order to determine how likely a cell is of being contaminated, the closest sand grain to each cell had to be found − if a cell is within the boundary of a sand grain, it will not be as invadable. The linear approach is to find the minimum distance between every sand grain for each cell. However this work would require over 280 million distance calculations if calculated linearly, significantly slowing down or even crashing the browser when it is time to load the grid.
Instead, the distances are determined using the powerful d3-delaunay library, which calculates each distance sub-linearly using Delaunay triangulation.
Three layers include grains, followed by a subgrid of cells, and delaunay triangles that help determine how the two overlap.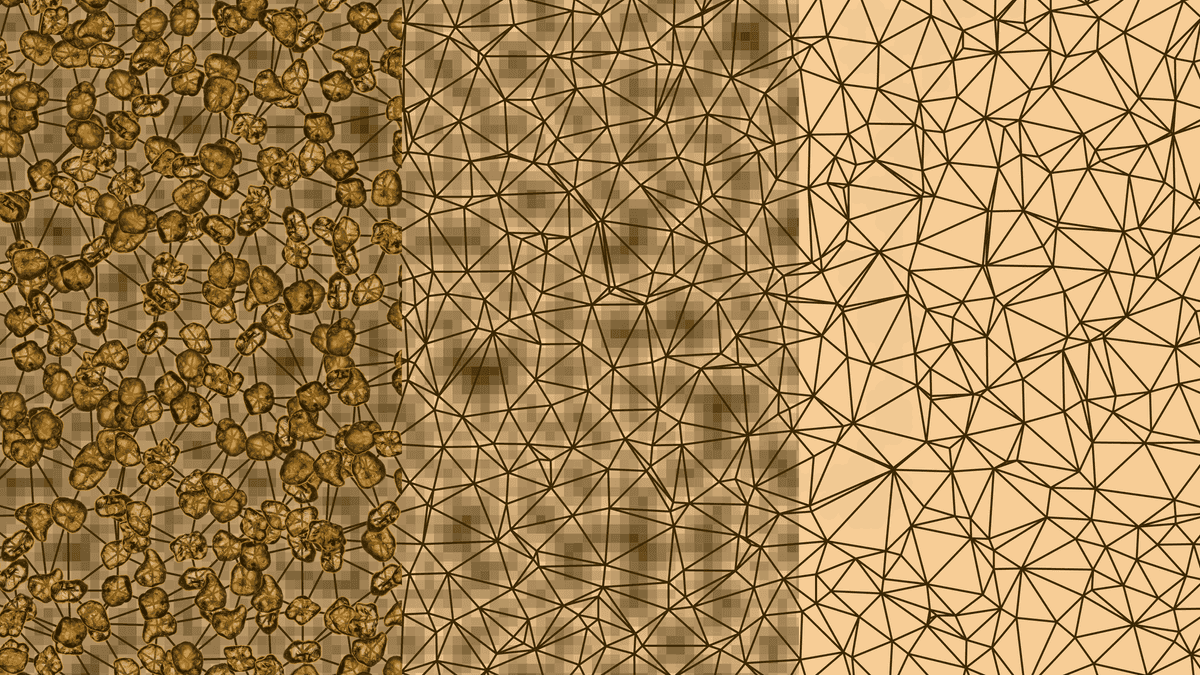
This process is sped up even more by loading the positions and r-values into a file that is read when the application is loaded. The tradeoff is the grid is static. A future version of Between the Sand could allow some file options such as exporting or calculating a new grid as needed.
Flow Direction
If you lay a sand column flat, the contamination percolates in all directions along the plane of the column. The experiments showed how a gas behaves when it is injected into sand filled with water. This can be simulated by positioning the flow direction upward. Cells at the bottom will now be less invadable, and cells near the top will be darker and more likely to be invaded.
The flow field is determined by multiplying each cell by a factor depending on the position of the cell, and multiplying the new factor by the r-value of the cell.
Setting the flow gradient dial to the lower right allows invasion percolation to move diagonally across the column while still following the pathways between the sand.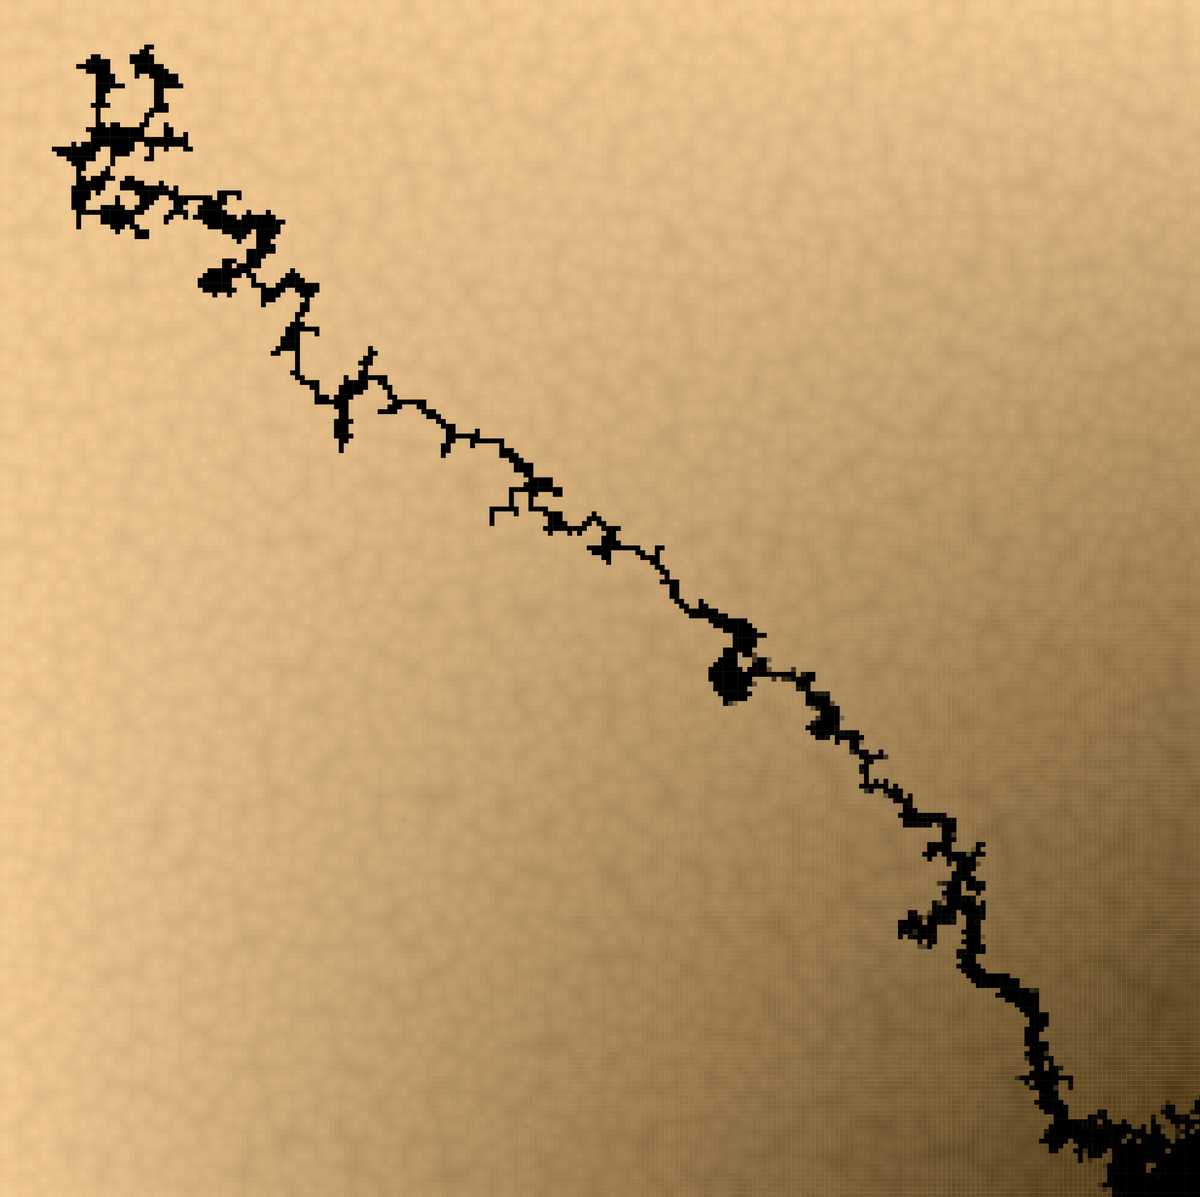
Pressure and Diffusion
The experiments I observed ranged from slow injections that lasted several minutes to high pressure injections that lasted only a second or two after they were initiated. The high pressure injections were impressive, and showed a network of interconnected pathways for a short while before being occluded.
Gas can also spread at different rates, depending on its viscosity. For example, sand could be filled with oil instead of water, or injected with creosote instead of gas. In this simulation, adjusting the diffusion and pressure can mimic different media and material.
Different diffusion settings are used to create this contamination pattern.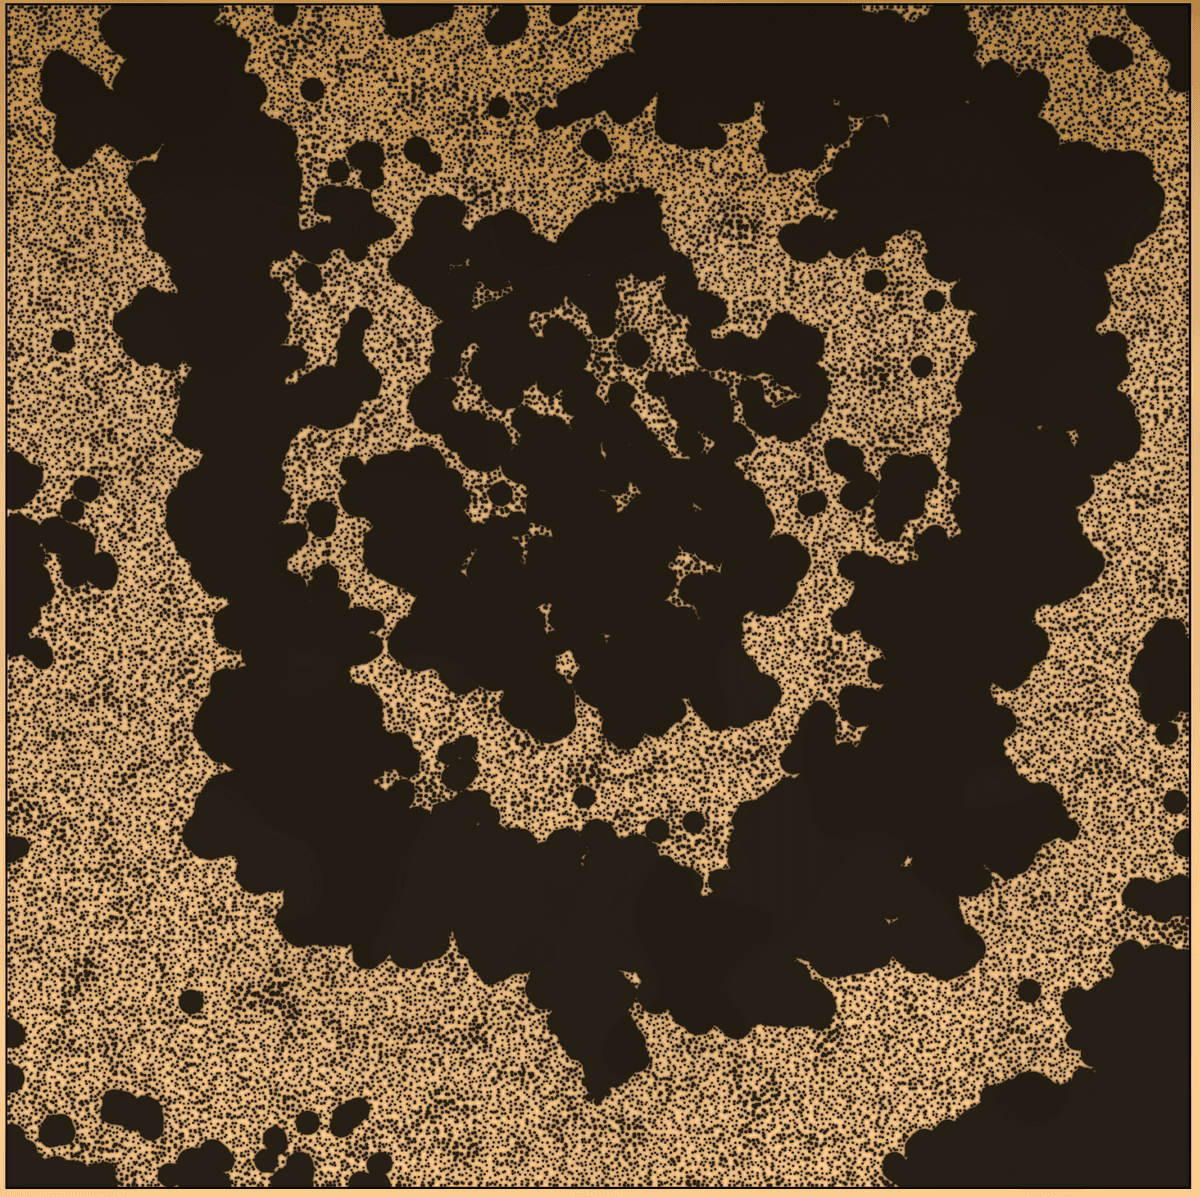
Survey
An online survey was embedded into the web application to invite participants to take part in an upcoming research paper. Findings are currently being compiled by Art the Science and a research paper about all three phases of the residency will be out soon.
An online survey was embedded into the web application to encourage people to take part in an upcoming research paper about the residency.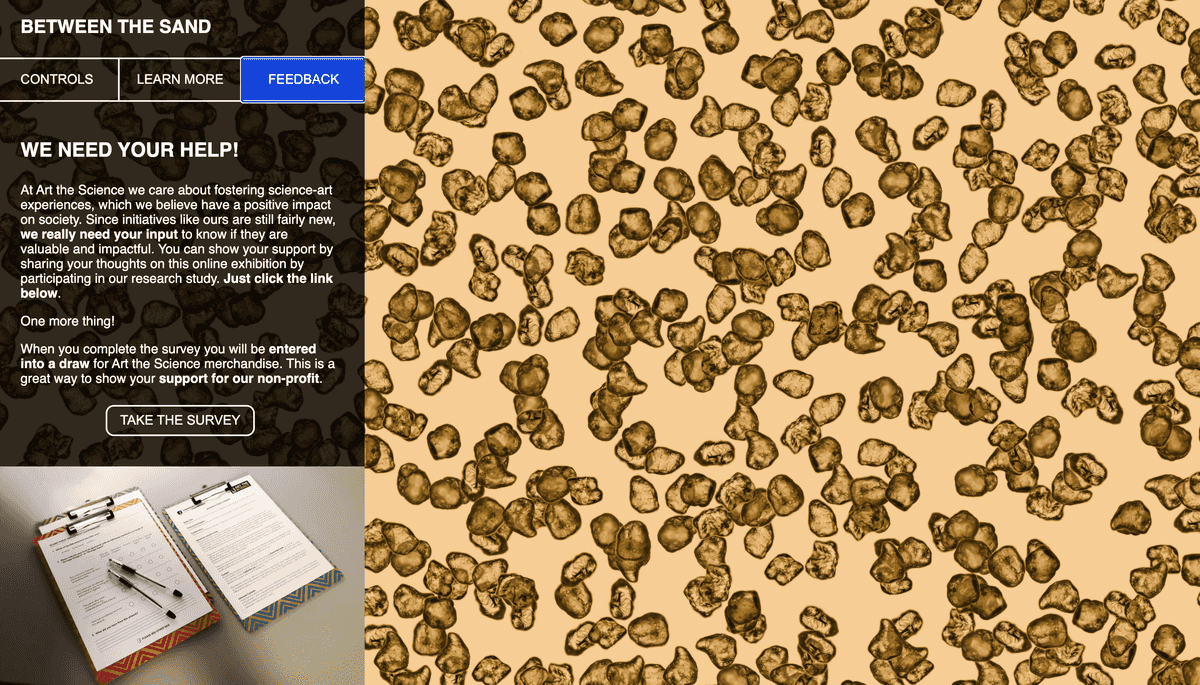
Between the Sand
Phase 1 - In the Lab
Phase 2 - Local Event
Phase 3 - Online Exhibition (this page)