d3js
d3.js stands for Data Driven Documents. It is a javaScript library for manipulating documents based on data. In other words, d3 can bind data in such a way that when the data is updated, the display is updated. This has led to d3 becoming a popular choice for custom web-based data visualizations and animations.
Visit d3.jsPOLLEN - Slack App, April 08, 2021
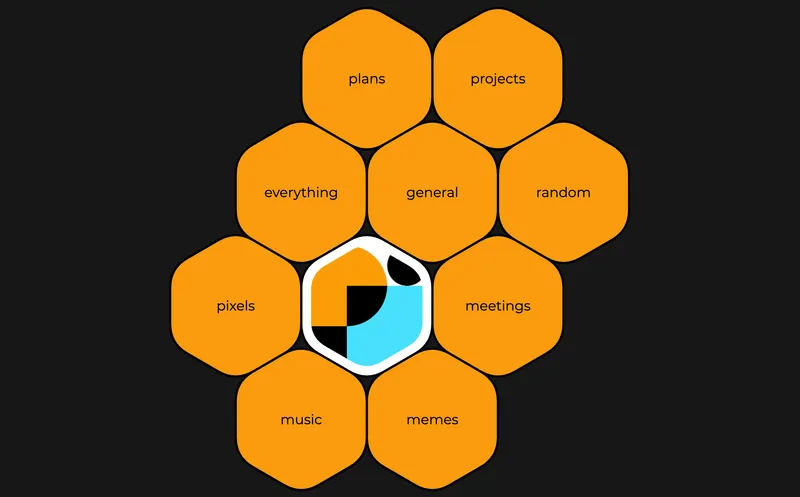
POLLEN started as an idea to visualize Slack workspace channels for the Data Visualization Society. The society has over 70 channels, and wanted a way to get a sense of the channel landscape and the discussions within.
Between the Sand - Phase 3 - Online Exhibition, December 05, 2020
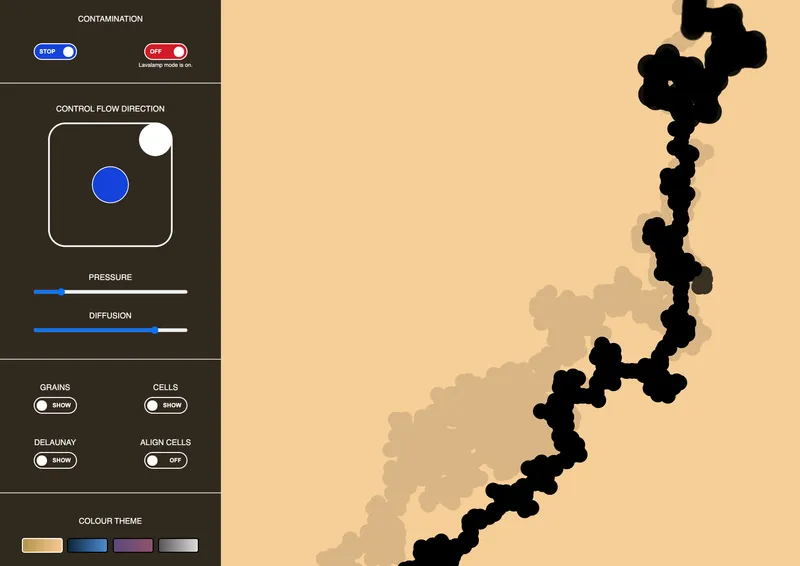
For the third and final phase of Between the Sand, we expanded and lauched an interactive web application that premiered in Art the Science's Polyfield Gallery on December 5th, 2020 to coincide with World Soil Day.
CSUCH - Data Visualizer, March 22, 2019
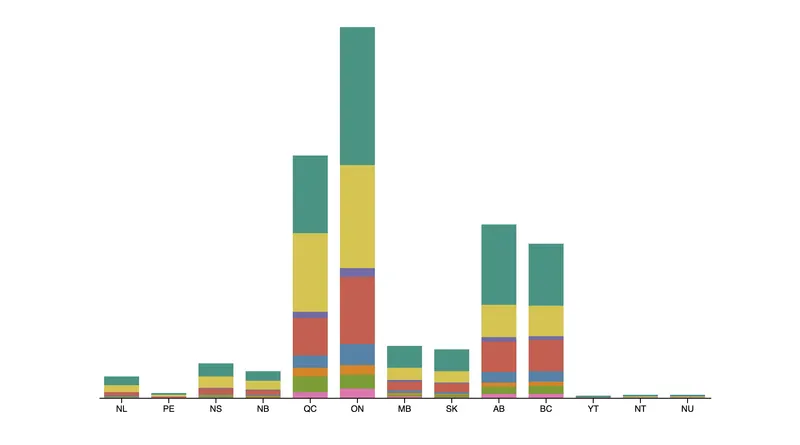
This data visualization tool displays the costs and harms of substance use in Canada, and offers options to filter and compare the data to better explore and understand trends and changes in how Canada spends its resources on substance use and addiction.
Between the Sand - Phase 2 - Local Event, February 27, 2019

Phase 2 of the Between the Sand residency was a public installation at the Modern Fuel ARC. The work was showcased for the first time alongside the sand coloumn used in the lab.
Multiloop, 3D Visualizer, October 18, 2018
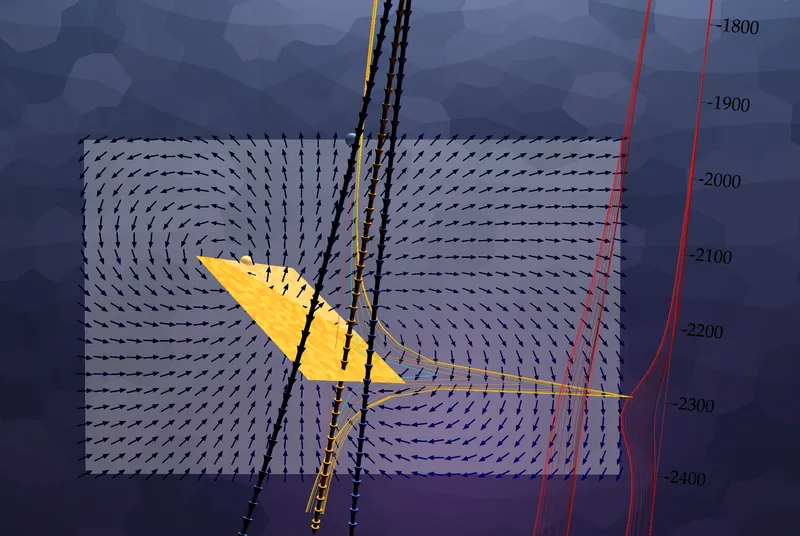
Multiloop is forward modelling software that helps geophysicists visualize electromagnetic responses from conductive meshes. This software is mainly used as a consulting tool that models data collected in the field and compares this to synthetic responses.
Community Flow, March 13, 2018
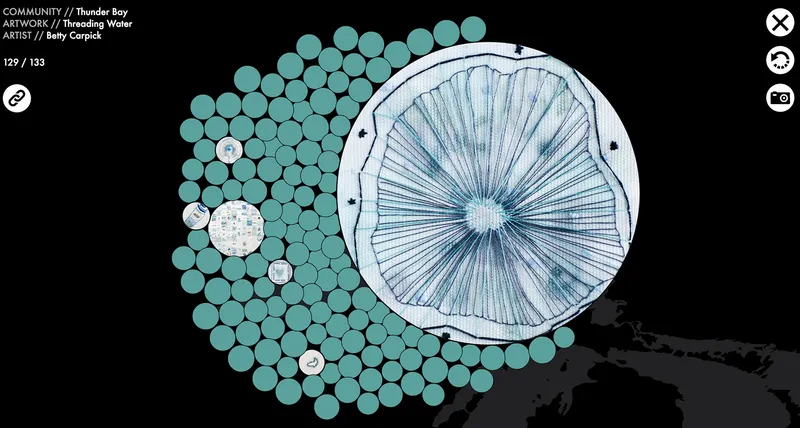
Community Flow was created to bring together artworks from eight communities on the Canadian side of the Great Lakes. Each community had an artist work alongside volunteers to create one artwork from many smaller contributions.
Electromagnetic Plotter, October 18, 2016
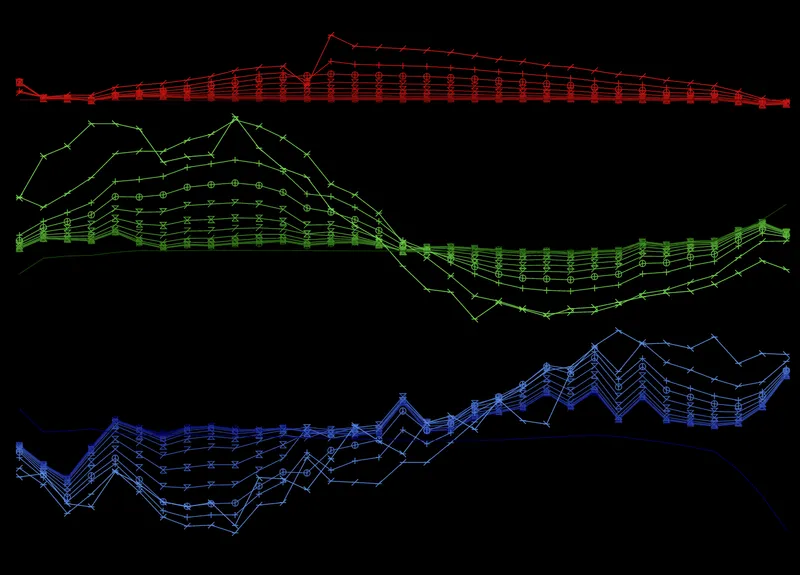
This is a web application that plots electromagnetic (EM) responses from imported files. Referred to simply as “plotter”, it is now used throughout the geophysics industry to plot time domain UTEM data in a web browser.